Fire emissions ran 9 % above average in 2024–2025 despite less burned area
The 2024–2025 fire season released more carbon than average even though less land burned, and the report's models find climate change made four extreme regional fire events more likely.
Why it matters
Global burned area totals can hide intense fires in carbon-rich forests, so tracking only area misses much of the damage. The report links recent extremes to human-driven climate change and projects that strong emission cuts would keep added risk small in the three tropical regions. It also shows where forecasting systems fall short, mainly in how they treat human ignitions and fine-scale weather.
What they did
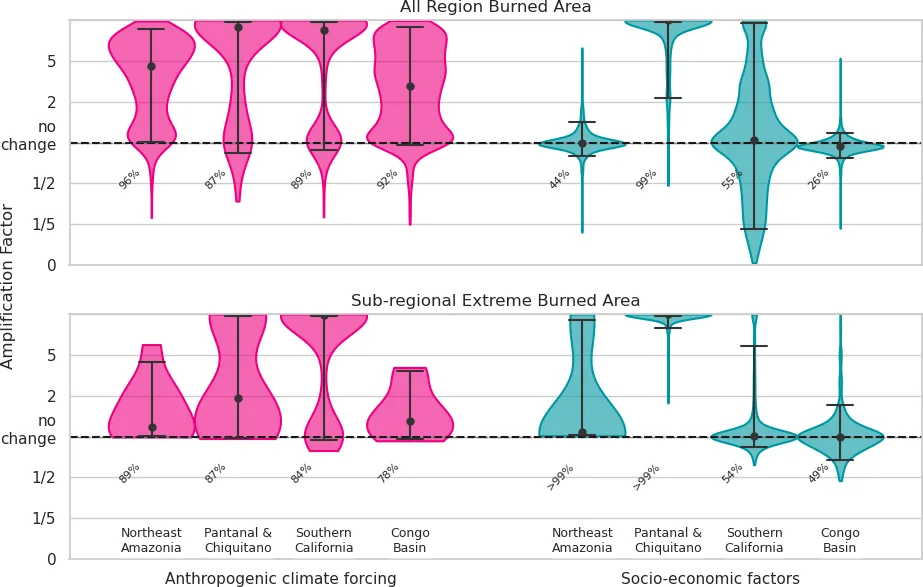
The authors tracked fire from satellite records of burned area, carbon emissions and individual fires, and consulted regional expert panels. They picked four focal events: Northeast Amazonia, the Pantanal–Chiquitano, Southern California and the Congo Basin. For each, they used fire-prediction models to find the drivers, weather-model ensembles and a burned-area model to compare today’s climate with one without human influence, and climate scenarios to project future risk. They also estimated exposure of people, assets and carbon projects, and smoke in the Pantanal–Chiquitano.
Key findings
- At least 3.7×10^6 km2 burned globally, 9 % below average. Fire carbon emissions were 2.2 Pg C, 9 % above average and the sixth highest since 2003.
- South America set a record for fire carbon emissions at 263 Tg C (84 % above average). Fire C emissions in Bolivia were over 4 times above average.
- Weather was the dominant driver in all four focal events. Fuel became more important in the most severe fires and shaped final burned area. Prolonged drought drove the three tropical events.
- Climate change made extreme fire weather 32 to 73 times more likely in Northeast Amazonia, 4.2–5.5 times in the Pantanal–Chiquitano and 3.0–8.0 times in the Congo Basin. Estimated burned area was 4.3, 34.5 and 2.69 times larger, with very wide uncertainty ranges.
- Under SSP370, 2024-scale events become up to 57 %, 34 % and 50 % more frequent by 2100 in the three tropical regions. Under SSP126 the rise is at most 11–13 % in those regions. Southern California projections are highly uncertain and may show a decline.
Limitations
- MODIS burned area misses small fires, so absolute values are underestimated. Several satellite products are being retired.
- Models represent human influence crudely (population density, land use), so ignition, suppression and the socioeconomic attribution are uncertain. In the Pantanal, the event and long-term socioeconomic results disagree.
- Burned-area attribution ranges are very wide, and Southern California projections depend on uncertain vegetation response to CO2. Models also missed the fine-scale winds behind the Los Angeles fires.
Glossary
- Fire Weather Index (FWI): A rating of fire danger built from temperature, wind, rain and humidity.
- Probability of Fire (PoF): A machine-learning model that predicts fire occurrence using weather, fuel state and ignition sources.
- Amplification factor: How many times larger burned area was with a factor such as climate change than without it.
- SSP126, SSP370, SSP585: Future emission scenarios, from strong mitigation (126) to medium–high (370) to no mitigation (585).
Original paper
State of Wildfires 2024–2025
Earth System Science Data · 15 October 2025
AI-generated summary of the original article; changes were made. Check the original before relying on it.