Across the Atlantic, microbes swap phosphorus-based membrane lipids for nitrogen, sulfur and carbon-rich ones when phosphate is scarce, and new lipid ratios can flag nitrogen or phosphorus stress in specific groups.
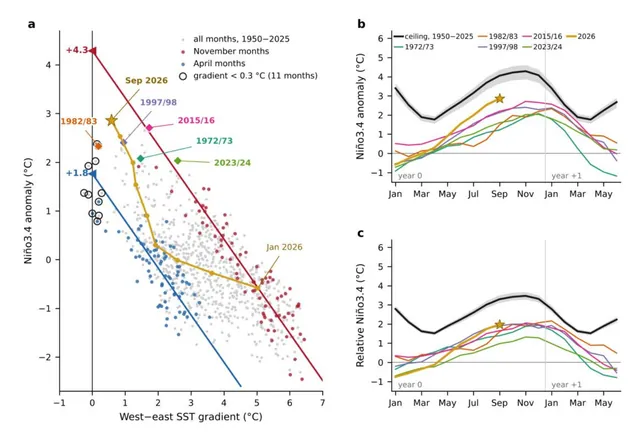
Extrapolating the shrinking west–east Pacific temperature contrast gives a seasonal El Niño ceiling, which no month since 1950 has passed, but the 2026 event will test whether it is a real limit.
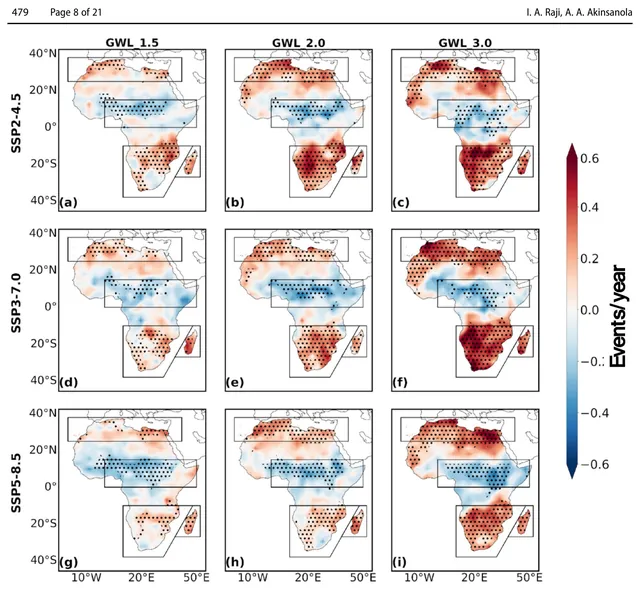
Climate models project more frequent, longer droughts over the Mediterranean, Southern Africa and Madagascar as warming rises, with different physical causes in each region, and limiting warming to 1.5 °C would avoid much of the impact.
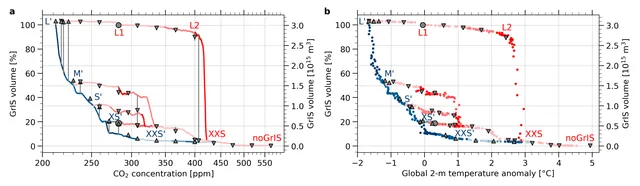
In this coupled model, the Greenland Ice Sheet collapses once warming stays near 2.55 °C, and it needs about 1.3 °C of cooling below pre-industrial to fully regrow.
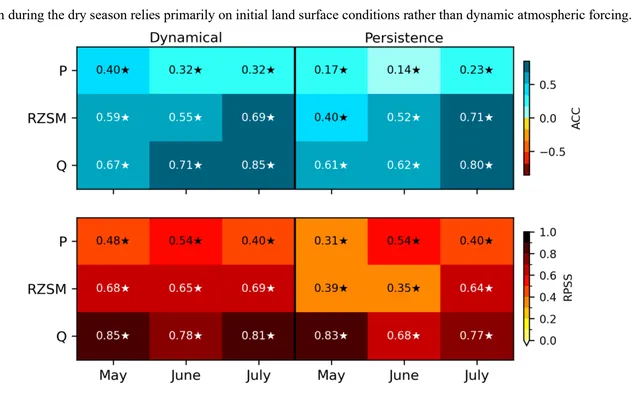
A 5 km land and river forecast system captured the 2024 Amazon drought up to 3 months ahead, but part of its streamflow skill came from a routing scheme that held dry anomalies too long.
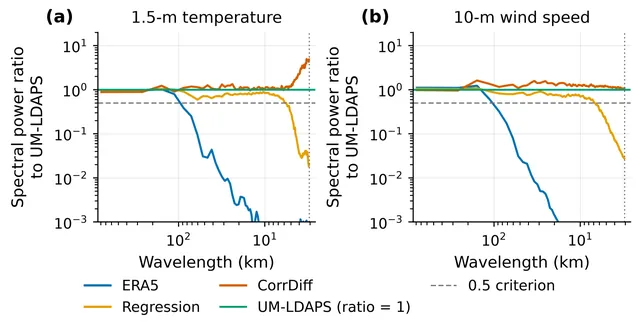
A diffusion-based downscaler for Korea added fine-scale variability and helped with the hottest events, but its added detail did not make forecasts more accurate overall.
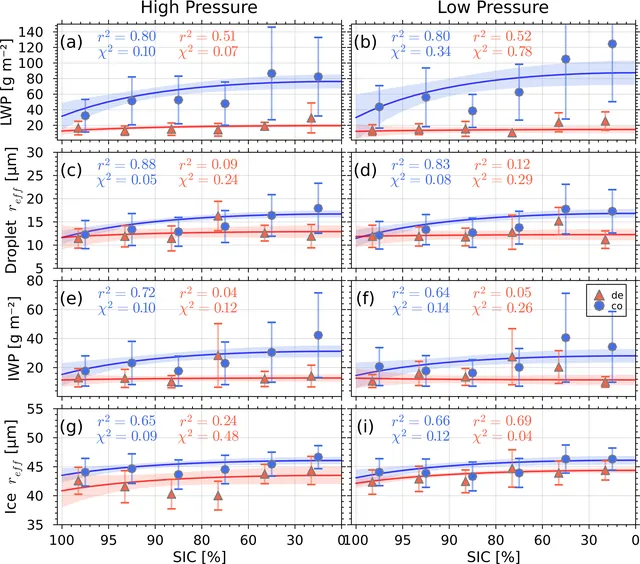
Over 14 winters at Utqiaġvik, mixed-phase clouds linked to upwind sea ice by water vapour transport hold more liquid water as sea ice concentration falls, and their properties also swing in multi-year cycles.
Atmospheric Chemistry and Physics
At Tatoosh Island, falling pH went hand in hand with less dissolved silicon relative to nitrogen and much less chlorophyll, which fits the idea that acidification removes silicon that diatoms need.
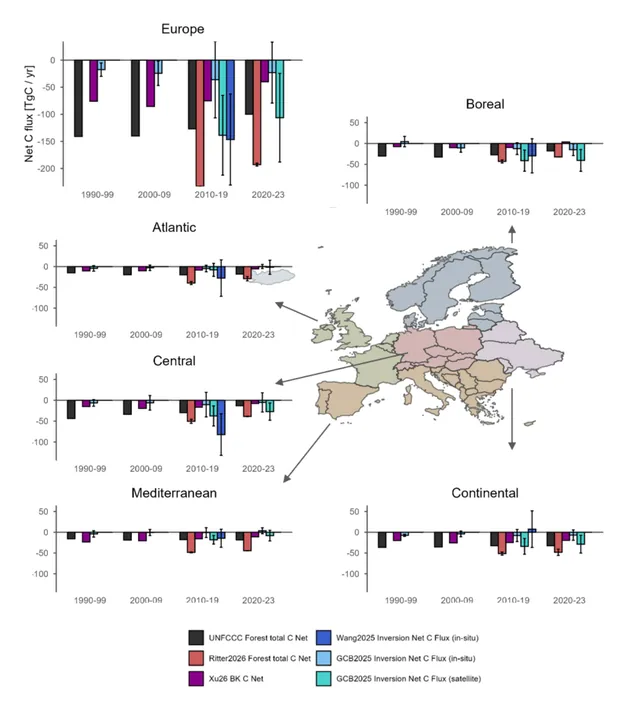
Satellite data, national inventories and atmospheric inversions all show Europe's forest carbon sink weakening, mainly in central and boreal Europe, but they disagree on how large the carbon losses are.
EGUspherePreprint
Strong El Niño events usually combine eastern and central Pacific warming, and climate models suggest strong mixed-type events become 33.5% more frequent under high warming.
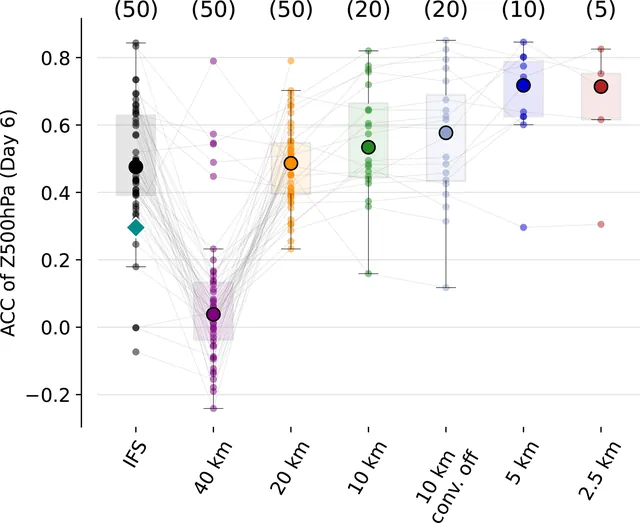
In three cases where the IFS forecast failed, global ICON runs with grid spacing of 5 km or finer better captured storm-driven upper-level potential vorticity (PV) changes and gave better day-6 skill, though some events stayed hard to predict.
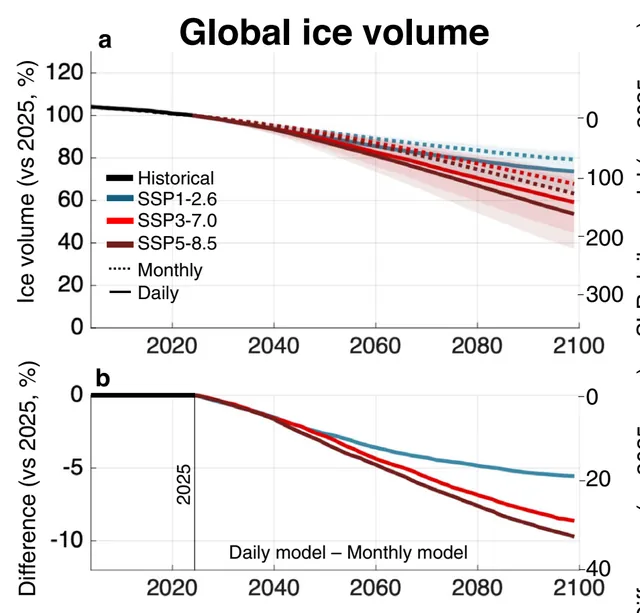
A global glacier model run with daily weather instead of monthly averages projects 5-10% more ice loss by 2100, adding 20-33 mm of sea-level rise.
Nature Communications
A coupled ocean and ice mélange model shows that perennial mélange can collapse within weeks once submarine melt passes a threshold set by fjord width and glacier calving flux.
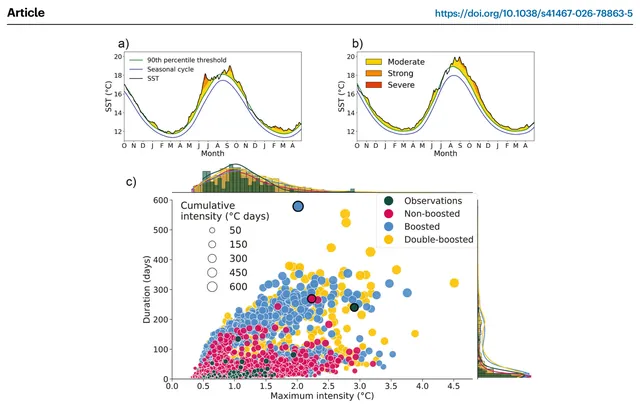
In a climate model, starting conditions like those of the 2023 North Atlantic marine heatwave can evolve into events much longer and hotter than the observed one.
Nature Communications
Under high-emission warming, 31 climate models show a weaker Northern Hemisphere summer high-latitude waveguide and less large-scale circulation variability, yet temperature variability linked to those patterns rises.
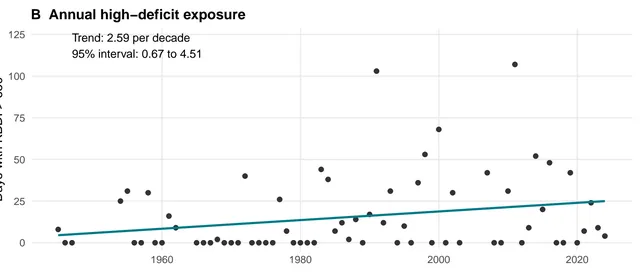
A drought index computed from the Tallahassee airport record shows rising annual dryness since 1945, clearest in May, but this does not prove forest-wide soil drying or a usable fire forecast.
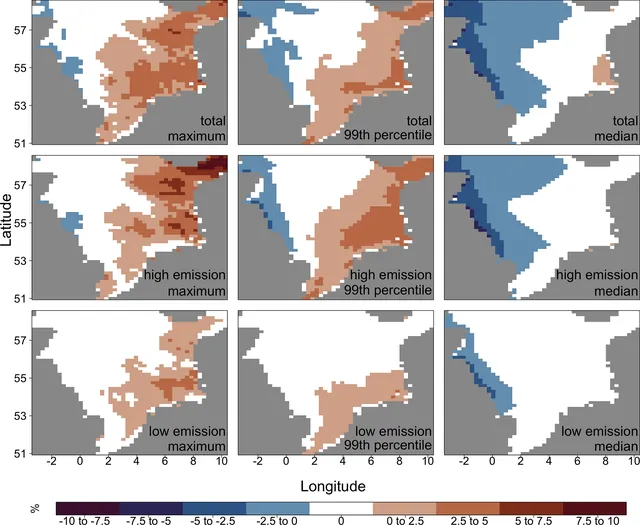
In a wave-model ensemble driven by CMIP3 and CMIP5 climate runs, end-of-century wave heights fall along the western North Sea and rise in the eastern North Sea and much of the Baltic Sea, more so under high emissions.
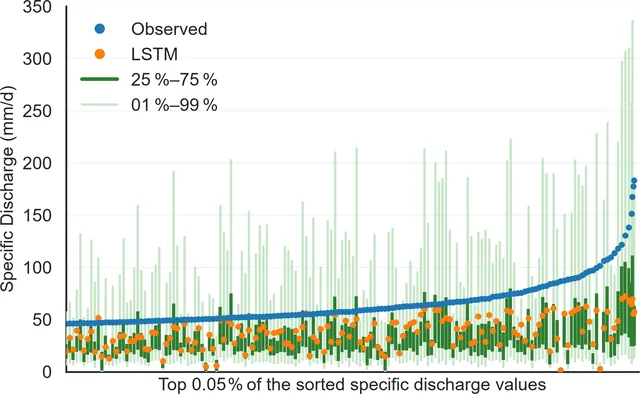
Letting an LSTM predict a full range of possible river discharges, not one value, puts most extreme floods inside its prediction range, and a learned agent can turn that range into warnings.
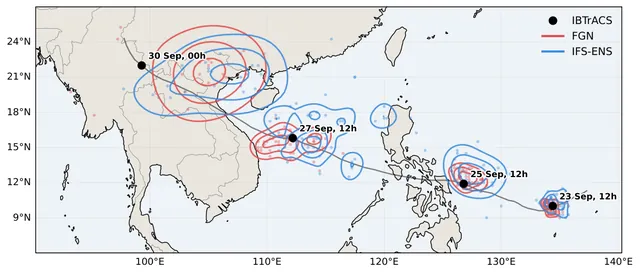
In this retrospective test, leading probabilistic AI weather models placed tropical cyclones more accurately than ECMWF's ensemble, yet they still underestimate winds and have poorly calibrated spread.
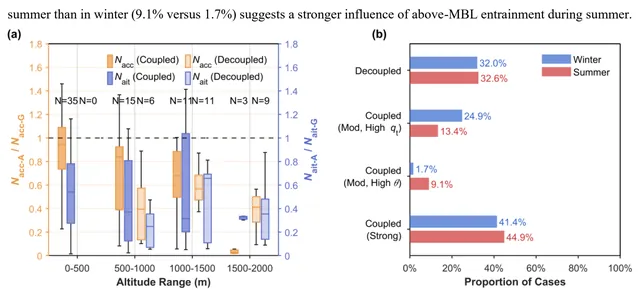
Over the Azores, summer cloud droplet numbers track accumulation-mode particle numbers, while in the cleaner winter air small Aitken-mode particles also matter, and decoupled boundary layers cut the aerosol that reaches cloud.
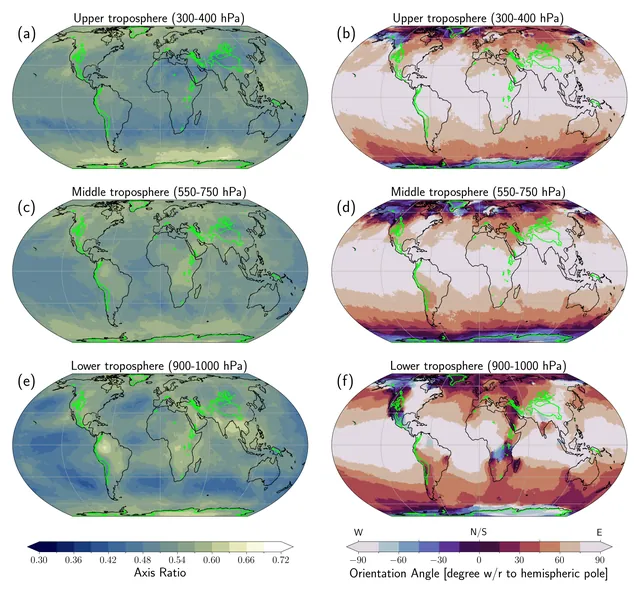
In ERA5, near-surface heat extremes are elongated ellipses with a typical equivalent radius of 800km, reaching the upper troposphere far less often in the tropics than outside it, so the "heat dome" picture misleads.
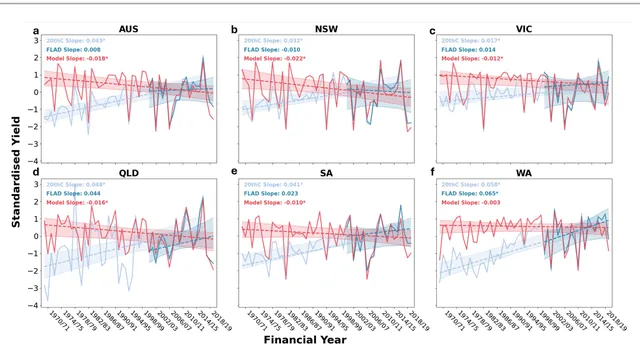
Using farm-level data, the authors find that climate extremes, mainly drought, drive most year-to-year wheat yield swings in Australia, and these extremes have grown since 1970 while technology has hidden the effect.
EarthArXivPreprint
In an idealized regional model run of the May 2023 heatwave, wetland cover cooled the Cambodian Mekong Delta by a few degrees, and the cooling was weaker with the smaller present-day wetland area.
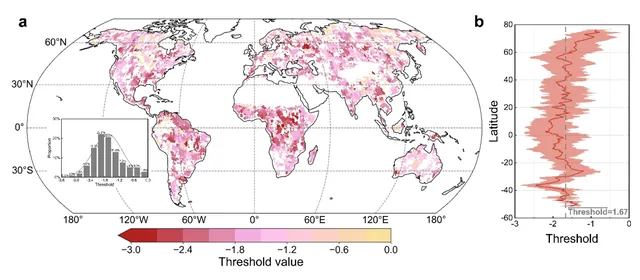
Ecosystem water use efficiency rises under mild drought but reverses once drought passes a threshold, so earlier reports of both rises and falls may describe two stages of one response.
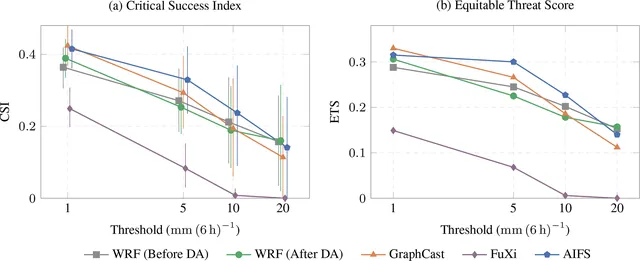
In three flood events, GraphCast and AIFS forecast light rain and temperature better than an observation-corrected WRF, but WRF leads at the heaviest rainfall rate.
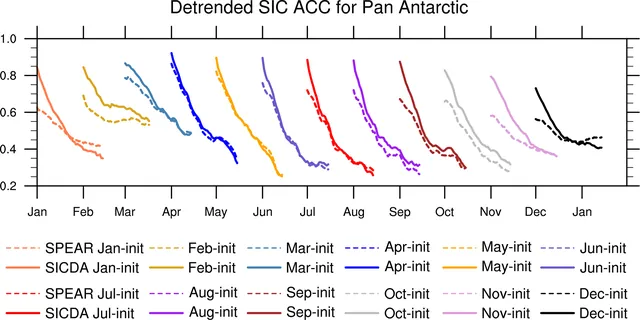
Feeding satellite sea ice concentration into the starting state of GFDL's SPEAR forecast system gives better Antarctic sea ice forecasts out to 45 days, with bigger gains than in the Arctic.
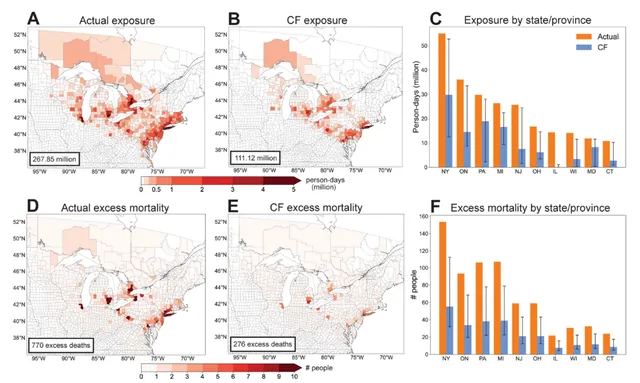
A rapid attribution study estimates that human-caused climate change made the July 2026 wildfire smoke event about three times more harmful, with 770 excess deaths versus 276 in a world without climate change.
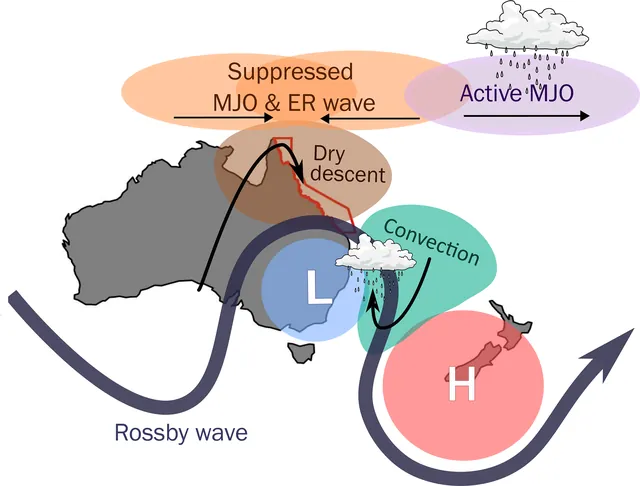
Doldrums over the Great Barrier Reef last longer when a cyclonic anomaly stalls over south-east Australia and tropical waves line up to keep westerly winds opposing the trade winds.
Weather and Climate Dynamics
In climate models, stopping CO2 emissions does not return the tropical Pacific to its pre-industrial state, because the slowly warming Southern and deep ocean keep an El Niño-like mean state in place for centuries.
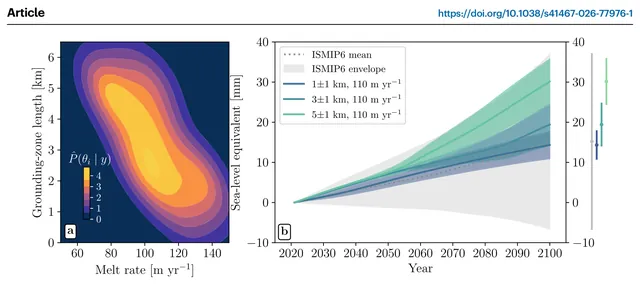
When an ice-sheet model lets seawater melt ice several kilometers inland of the grounding line, it matches 27 years of Thwaites observations and projects about twice the earlier sea-level contribution by 2100.
Nature Communications
A method built on delay-embedding theory, called DSDL, kept more forecast skill than five other data-driven methods when variables were hidden, and it gave useful one-month-lead summer rainfall hindcasts for China.
Five temperature records show warming of 0.40 °C per decade in 2011–2025, about double the long-term rate, and if that pace holds the 1.5 °C level is crossed around 2028.
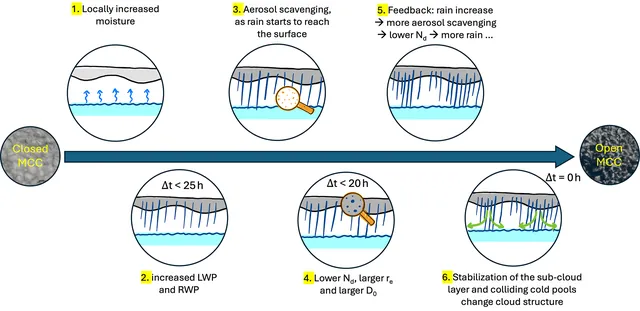
EarthCARE and GOES data show that in stratocumulus, liquid water and rain rise first, then droplet numbers fall, over about 25 hours before closed cells turn into open cells.
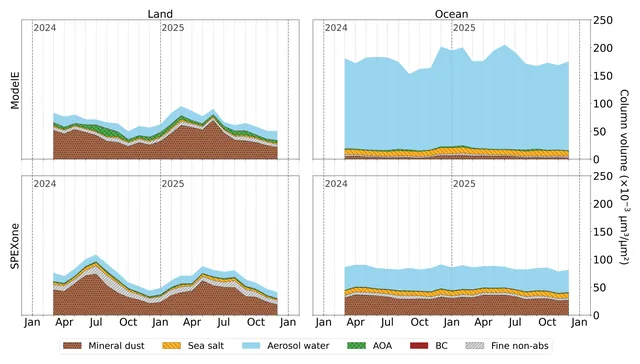
The first comparison of PACE SPEXone aerosol composition with a climate model finds good fine-mode agreement over land, but a large ocean mismatch in mineral dust and aerosol water that the authors trace partly to retrieval assumptions and partly to the model.
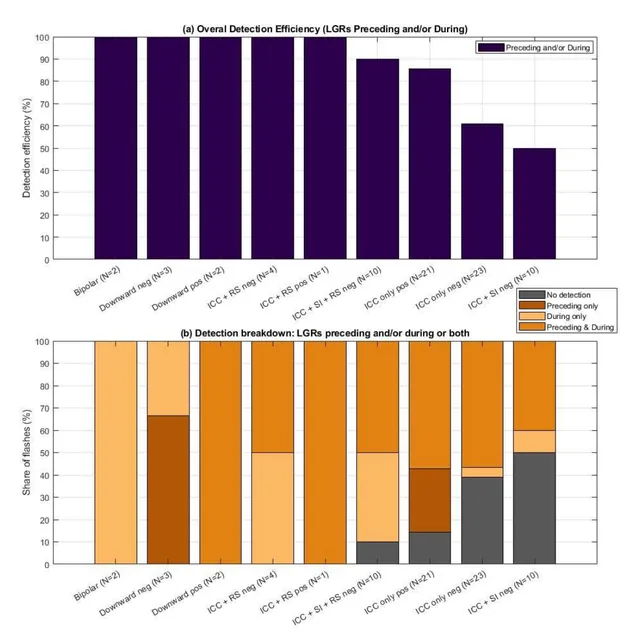
Checked against direct current measurements at one wind turbine, the Meteosat-12 Lightning Imager saw most upward flashes, mainly through cloud-top light from the wider flash rather than the strike point.
EGUspherePreprint
In a climate model, a neural network predicts East Asian winter temperature from November conditions, and warm extremes become easier to predict under strong warming while cold extremes stay about the same.
Fifteen years of mountaintop sunlight measurements show the methane-to-CO2 excess ratio over Los Angeles has stayed flat, so methane has fallen no faster than CO2 and no methane-specific policy effect is visible.
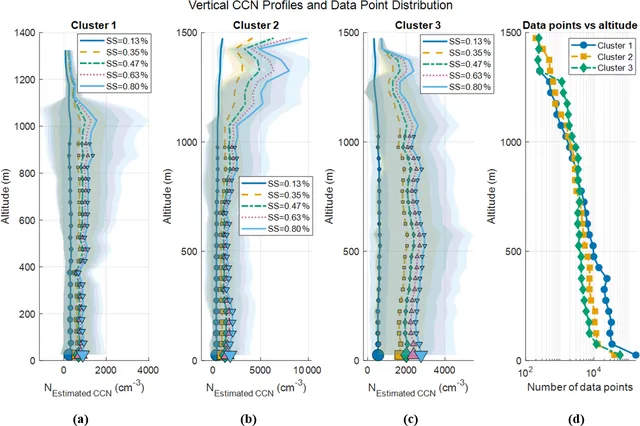
Over Houston, the number of particles able to seed clouds depends strongly on where the air came from and on boundary-layer depth, and weather can change both at once.
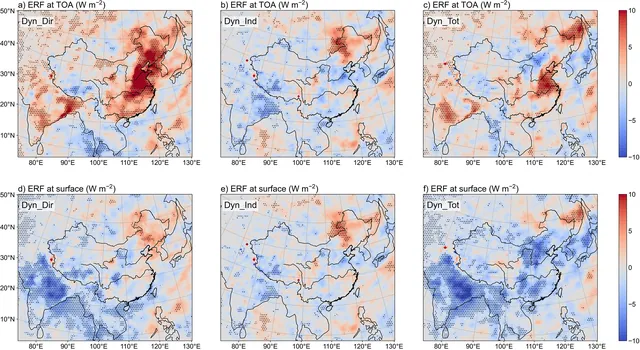
Letting black carbon aging speed vary with local pollution, instead of fixing it at 1.15 days, lowers BC column burden, raises near-surface BC in parts of eastern China, and changes the simulated radiative forcing and the summer north-dry, south-wet pattern.
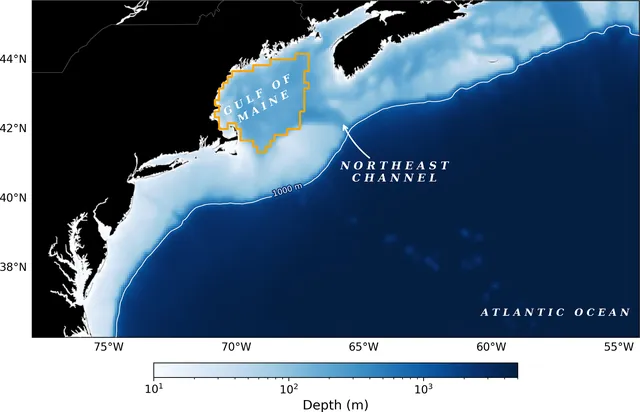
A high-resolution regional ocean model can forecast Gulf of Maine bottom conditions for several years, and it points to cooler water, more oxygen and lower pH and aragonite saturation through 2027.
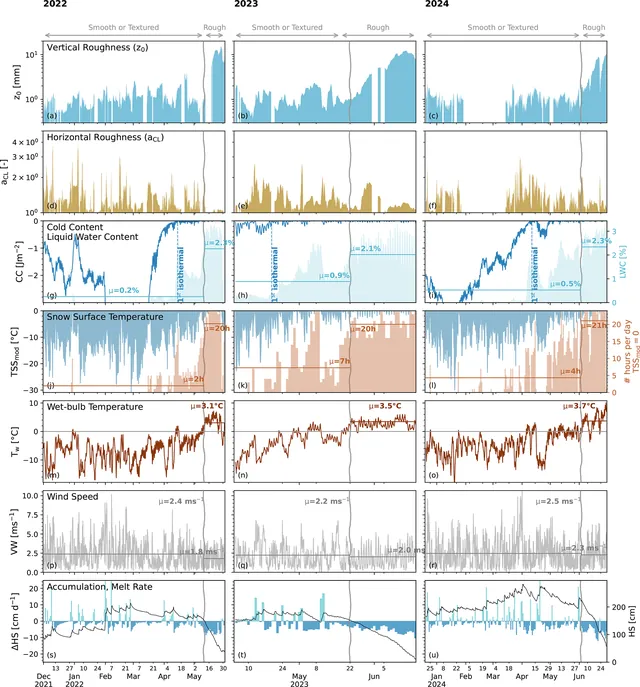
Over three melt seasons in the Swiss Alps, suncup roughness and impurities together lowered snow albedo by 0.03–0.1, and albedo follows a logarithmic curve with aerodynamic roughness length z0.
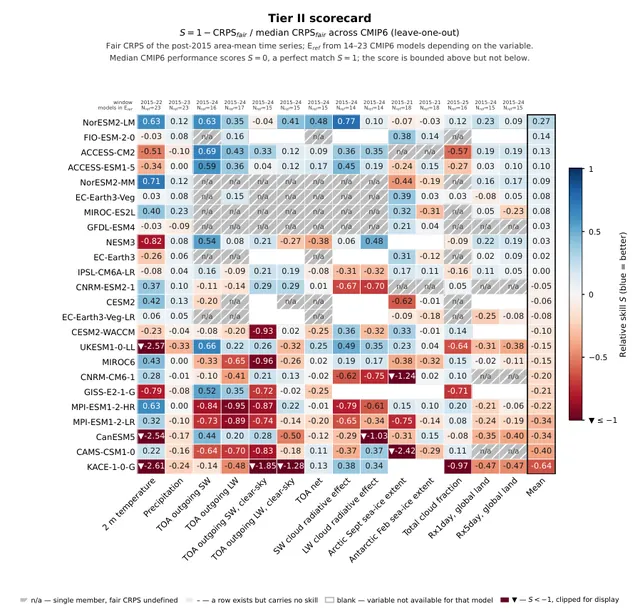
ClimateBench v2 proposes an open, three-tier test that holds back all observations after 2015 and scores any climate model, physical or machine-learned, with probabilistic skill scores.
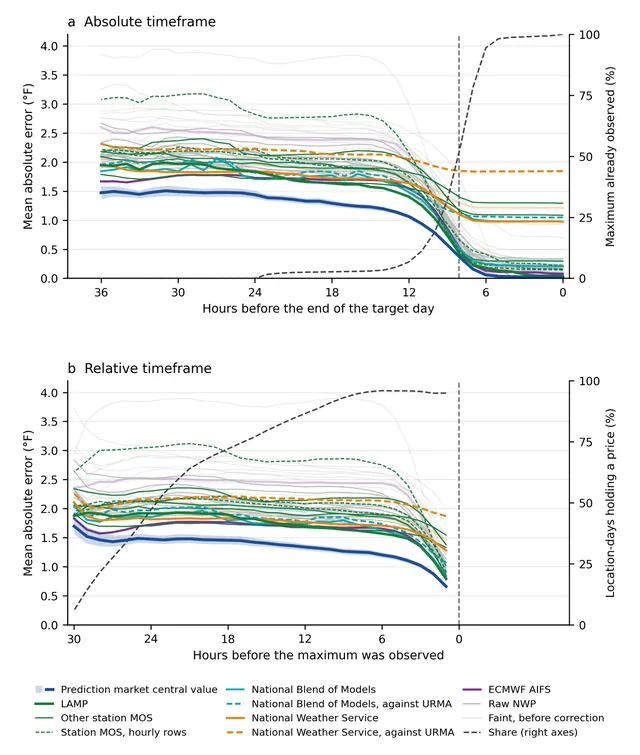
In this preprint, prices on a daily-high-temperature prediction market had lower error than 20 operational forecast systems, including statistically corrected and human-edited forecasts, at nearly all lead times.
EarthArXivPreprint
Feeding a deep learning nowcast model three-dimensional atmospheric forecasts, and boosting strong echoes, improved 12 h radar reflectivity and rainfall forecasts over East China compared with the baselines.
AERO-ODE refines coarse global model output with terrain and surface information to make fast 3 km regional forecasts that, over two US regions, beat WRF-ARW and a deep-learning regional model on most error measures.
Coarsening the same rainfall data in space or time lowers measured intensity, and sliding the amount distribution along a log axis captures most of that change.
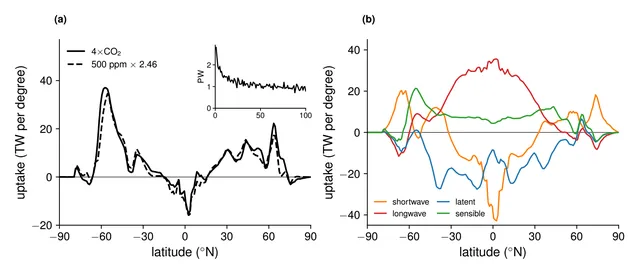
In one climate model, the Southern Ocean's heat uptake under 4×CO2 is mostly set by the old circulation, with upwelling fixing its size and along-isopycnal diffusion fixing its slow decline.
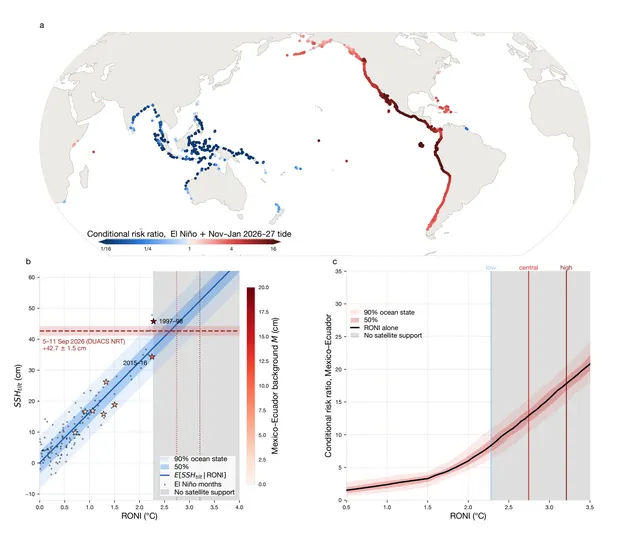
A preprint analysis finds that El Niño raises coastal extreme sea-level risk mostly by lifting background sea level along the eastern Pacific, and that the projected 2026–27 super event could make the old 99th-percentile high water a recurring event there.
EarthArXivPreprint
By modeling how often satellites miss small emissions, the authors estimate annual methane output for 1924 oil-gas point sources, finding higher persistence and higher emissions than earlier estimates.
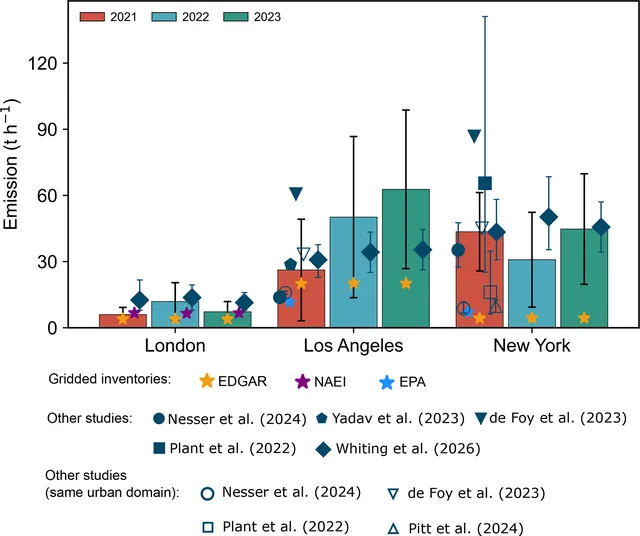
An improved mass-balance method using TROPOMI satellite data and boundary-layer winds finds city methane emissions well above bottom-up inventories, with large uncertainties.
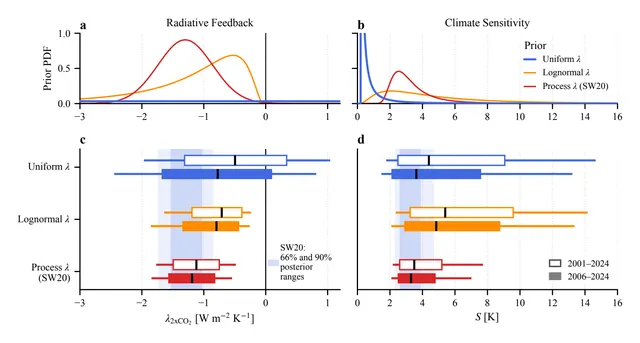
Satellite-era energy-budget trends point to high climate sensitivity if you take them at face value, but once uncertainty is included they fit the 2 to 5 K range from earlier assessments.
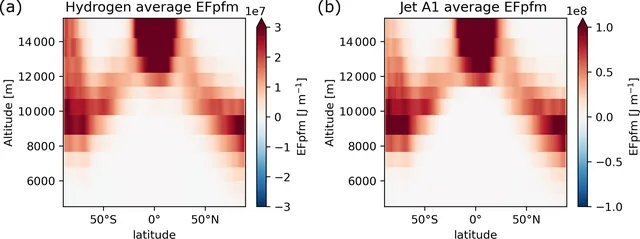
In a model, hydrogen-powered aircraft make contrail cirrus with much less warming than jet fuel aircraft in most cases, but lubrication oil droplets could erase the benefit.
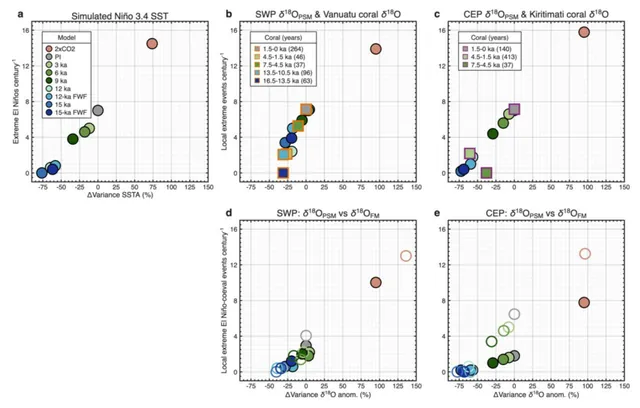
Coral records from Vanuatu dated to about 12 and 15 thousand years ago show weaker year-to-year variability, and climate model runs suggest El Niño and its extreme events grow as the climate warms.
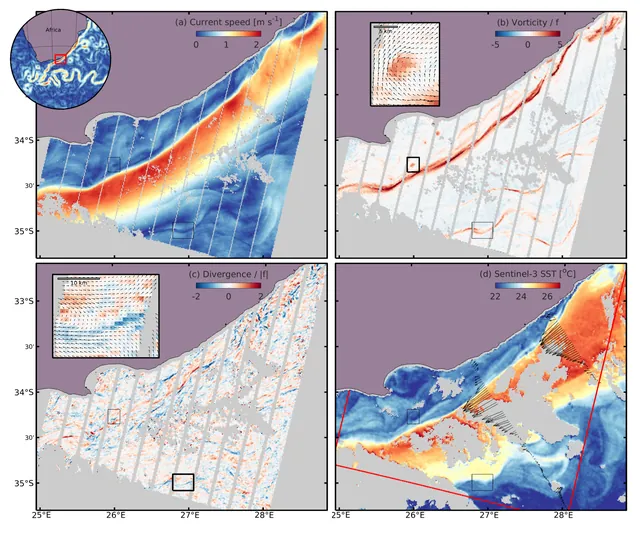
Two optical satellites flying 27 s apart can track short wind waves and so map surface currents at 1 km scale, showing fine-scale divergence that altimetry misses.
EarthArXivPreprint
Carbonate crusts on Antarctic rock record surface meltwater, and their ages match peaks in southern summer sunlight above about 540 W/m2 rather than warm air temperatures.
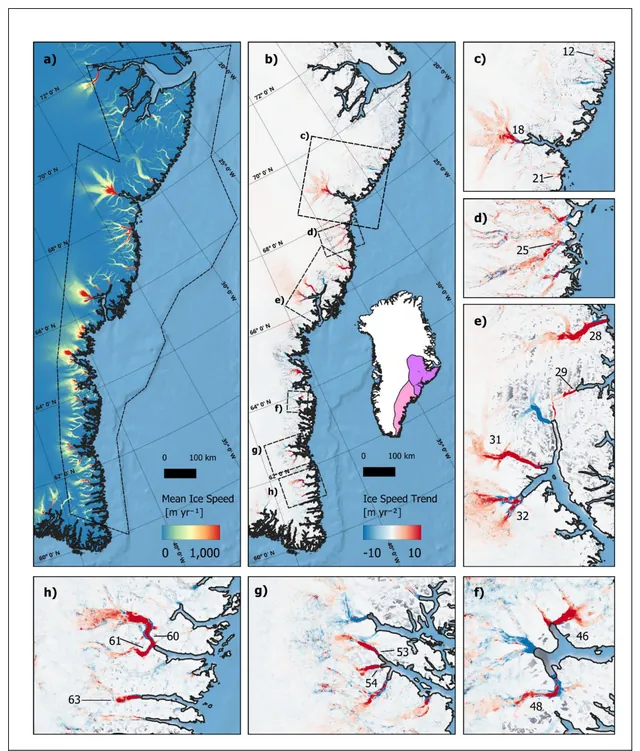
Satellite data show that most of 66 marine-terminating glaciers in central and southeast Greenland accelerated together from 2016, peaked around 2020, then slowed only partly, as warm ocean water appeared at the same time.
EGUspherePreprint
AI atmosphere models driven by forecast ocean temperatures can match or beat a leading physics-based model for seasonal storm counts in the Atlantic and eastern Pacific, but not everywhere, and some of that skill may come from compensating errors.
Training an AI weather model through a fast, differentiable radiation emulator improved its forecasts of surface sunlight and cloud cover compared with the same model without that constraint and with ECMWF HRES, though not for surface albedo.
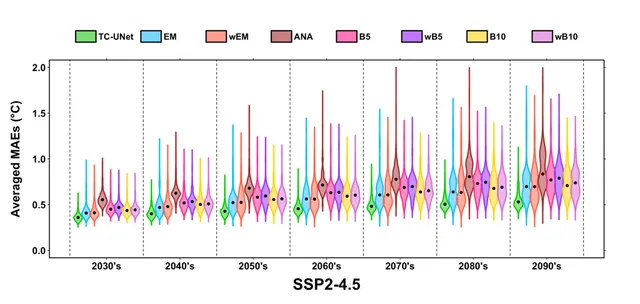
A neural network trained on 290 climate-model runs can forecast local future decadal temperatures from the 1980–2025 record, keeping internal variability in its uncertainty, and the authors report skill beyond ensemble averaging.
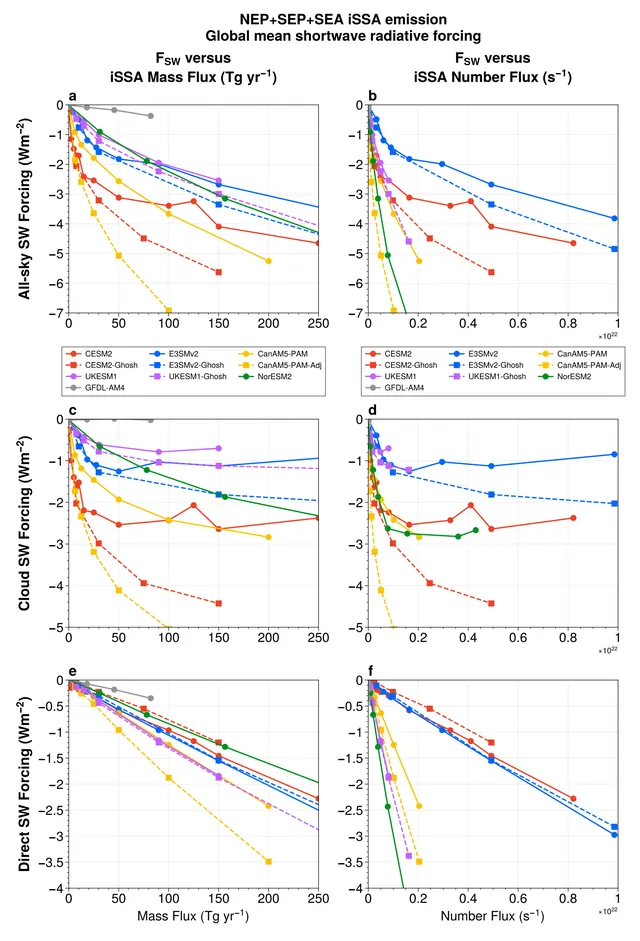
In this preprint, ten model setups need very different amounts of injected sea salt to reach -2 Wm-2, and the gap comes mostly from particle size, droplet activation and cloud adjustments.
EGUspherePreprint
A 1941 heatwave in Western North America, about 1.7 °C cooler than the 2021 event, caused broad impacts that were not just milder versions of 2021's, because weather, society, and infrastructure differed.