Drought and late-season heat are worsening for Australian wheat, masked by better farming
Using farm-level data, the authors find that climate extremes, mainly drought, drive most year-to-year wheat yield swings in Australia, and these extremes have grown since 1970 while technology has hidden the effect.
Why it matters
Australia is a major wheat exporter, so climate risks to its crop can reach world markets. The authors report that gains from technology and management have so far hidden a steady worsening of growing conditions. This raises the question of whether those gains can keep offsetting future increases in drought and heat.
What they did
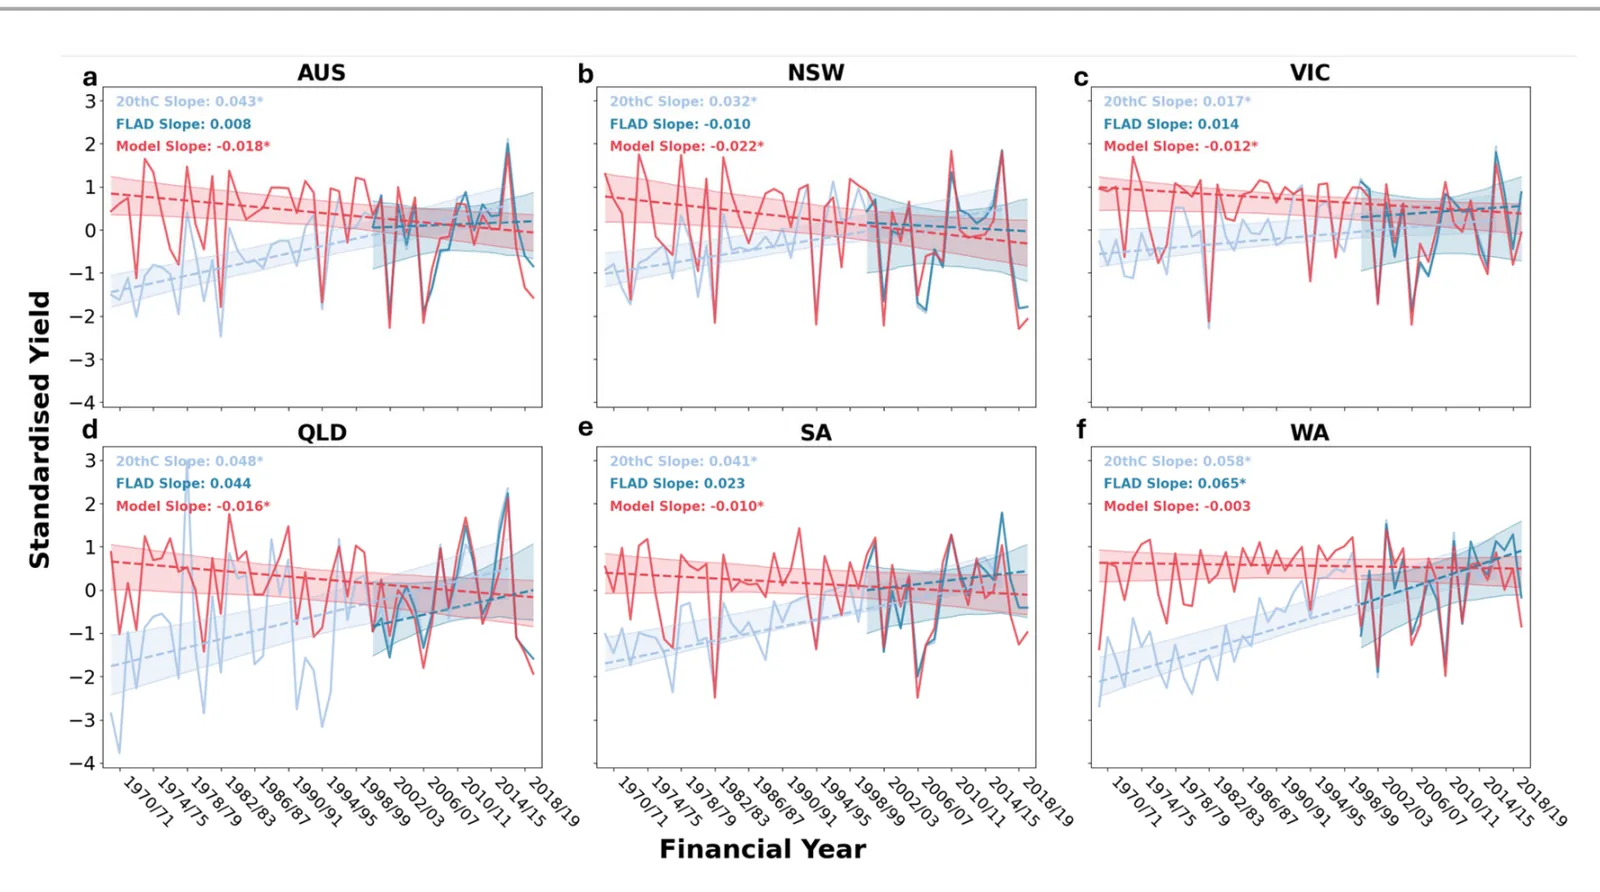
The team used a new farm-level yield dataset covering 2000/01 to 2019/20, mapped onto a 0.05° grid. They paired it with gridded weather and modelled soil moisture. They built random forest models for each major wheat state, using 14 climate indices for the whole season and for early, mid and late stages. They compared model skill on withheld years and ranked predictor importance. They then tested trends from 1970 to 2020 in the key extremes and in yield predicted from climate alone.
Key findings
- Models using all climate variables explain 0.69 of year-to-year yield variability nationally, and 0.52 to 0.70 in individual states.
- Models using only extremes explain 53% to 74% of variability, versus 19% to 49% for non-extreme variables. Drought variables alone explain 43% to 77%.
- Drought days are the top driver, and late-season drought and late-season heatwave intensity have the largest effects.
- Between 1970 and 2020, 72% of the wheat belt saw a significant rise in growing season drought days, and over 90% saw a significant rise in late-season heatwave intensity.
- Observed yields rose in all major regions, but climate-driven yield fell nationally and significantly in four of five states.
Limitations
- Soil moisture comes from a model, not observations, and may carry larger biases than the rainfall data. Soil moisture droughts ranked lower than expected.
- Only 20 years of farm-level yield data were available. Yields were not detrended, and the 1970 onward yield series is state-level only.
- Heavy rain, hail and fire were left out, and Tasmania was excluded because of too little data. Temperature extremes may rank high partly through links with drought.
Glossary
- Random forest: A machine learning method that averages many decision trees to predict an outcome from several inputs.
- Climate-driven yield: The yield the random forest predicts from growing season climate variables alone.
- Feature importance: A score of how much a model’s error grows when one input is shuffled, showing how much the model relies on it.
- Drought day: A day when the 180-day rolling mean of rain or soil moisture falls below the 15th percentile.
Original paper
Deteriorating climate conditions for Australian wheat production
EarthArXiv · 14 October 2026
This paper is a preprint. It has not been peer reviewed, and its results may change.
AI-generated summary of the original article; changes were made. Check the original before relying on it.