A prediction market beat 20 operational systems at forecasting daily high temperatures
In this preprint, prices on a daily-high-temperature prediction market had lower error than 20 operational forecast systems, including statistically corrected and human-edited forecasts, at nearly all lead times.
Why it matters
Markets are known to do well on questions about human behavior. This study suggests they may also add value where physics models, statistical correction and expert forecasters already exist. The result is not yet peer reviewed, and the author works for the company that owns the exchange.
What they did
The author compared ForecastEx daily maximum temperature market prices at 24 US airport stations with 20 operational forecast systems. The period ran from 11 February 2026 to 1 October 2026 and covered 5,405 location-days. Market prices were turned into a central value and scored by mean absolute error. Four ensemble systems were bias-corrected with a basic statistical method (EMOS) and compared with the market’s full distribution using CRPS. Each alternative was scored against the observation it was built to predict, and alternatives were not penalized for forecasts already falsified by observed temperatures.
Key findings
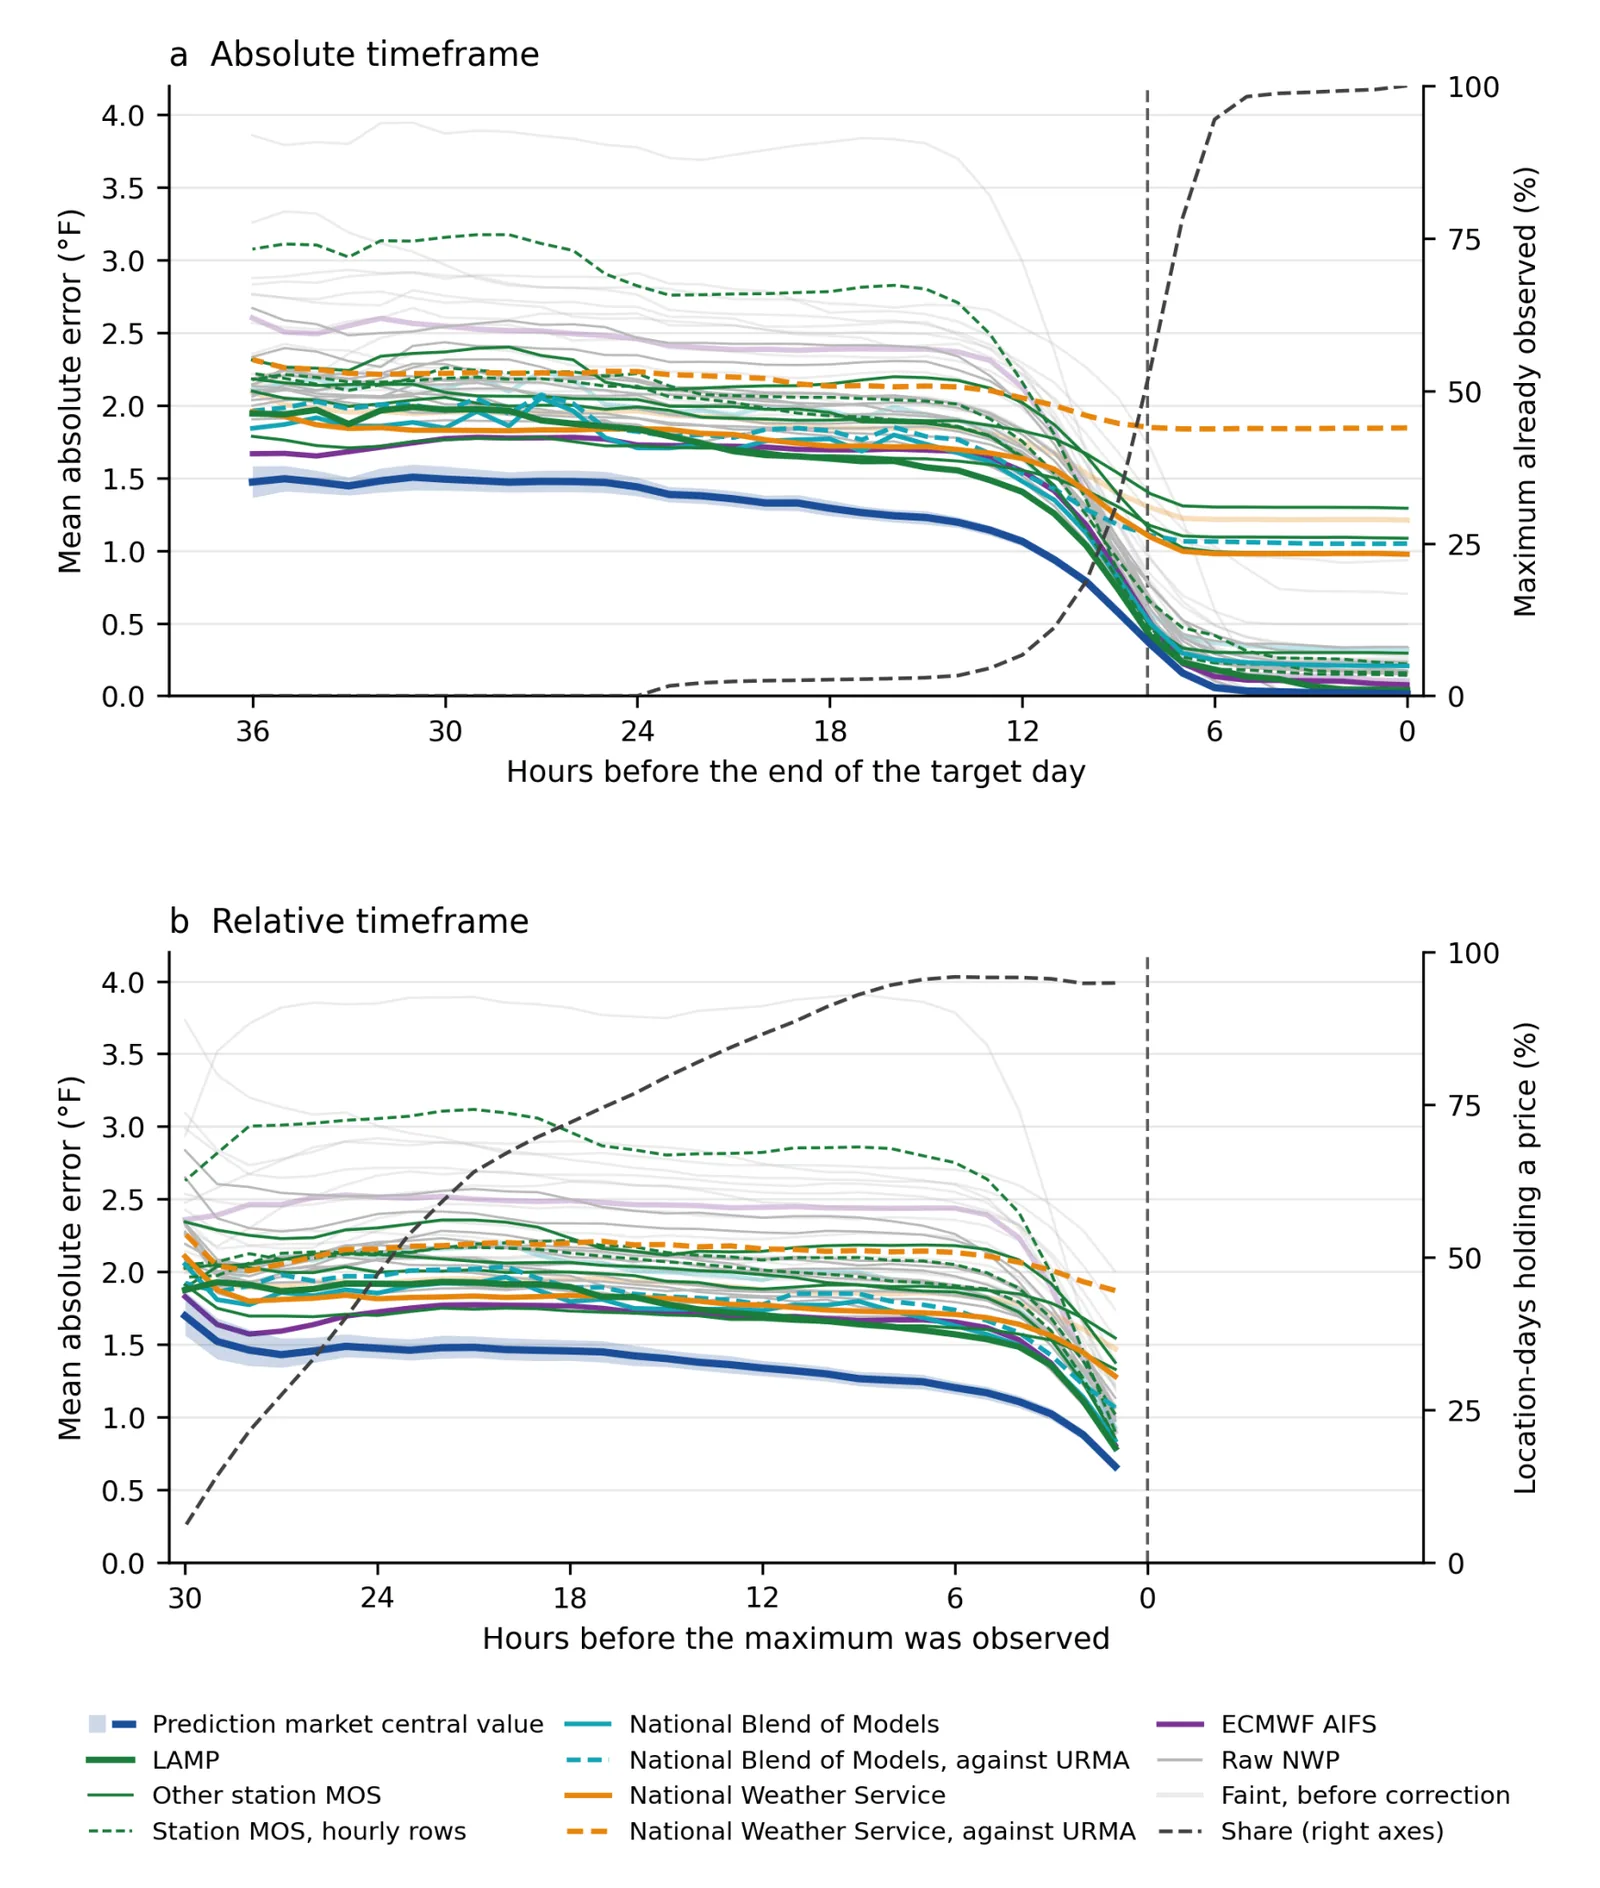
- At 6:00 PM local time the evening before, the market’s mean absolute error was 1.49°F. The closest alternative, the NBM station bulletin, scored 1.76°F (17% [14%, 19%] lower).
- Counted to the end of the target day, the market had significantly lower error than all 20 systems at 33 of 37 hourly leads. Counted to the time of the maximum, it did so at 29 of 30 leads.
- On full probability distributions, the market’s CRPS was 1.06°F against 1.19°F for the best corrected ensemble (ECMWF AIFS), which is 11% [8%, 15%] lower. Market prices were also closer to calibrated.
- Across all series and locations the market was ahead in 1,178 of 1,186 comparisons at the two absolute leads.
- The advantage was not explained by how often alternatives update. Sampling alternatives only when they had just refreshed left the pooled improvement at 32%.
Limitations
- The author is employed by a subsidiary of the company that owns the exchange, and says the findings were welcome to him and his organization. The work is a preprint and not peer reviewed.
- The study covers one exchange, 24 US locations and about eight months, and the market price source changed partway through the record (trade record, then order-book capture).
- The paper does not identify why the market is more accurate. Its explanation, that the market combines information and possibly adds new information, is an interpretation rather than a tested mechanism.
Glossary
- Model output statistics (MOS): Statistical corrections that turn raw weather model output into forecasts for specific stations.
- CRPS: Continuous ranked probability score, which extends absolute error to a full probability distribution. Lower is better.
- EMOS: Ensemble model output statistics, a regression-based way to correct the bias and spread of ensemble forecasts.
- National Blend of Models (NBM): A calibrated multi-model blend from NOAA, used as the starting point for the National Weather Service forecast.
Original paper
Improvement of Daily Temperature Forecasts from a Prediction Market
EarthArXiv · 3 October 2026
This paper is a preprint. It has not been peer reviewed, and its results may change.
AI-generated summary of the original article; changes were made. Check the original before relying on it.