Observations
New weather and climate research on observations, one page per paper.
All summaries
-
 Observations
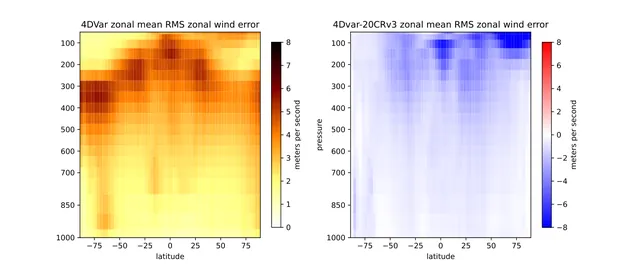
Long-window 4D-Var with NeuralGCM beats 20CRv3 using only surface pressure
A differentiable weather model lets a simple long-window 4D-Var, with no background-error term, fit surface-pressure observations and give analyses closer to ERA5 than 20CRv3 over three months.
-
 Observations
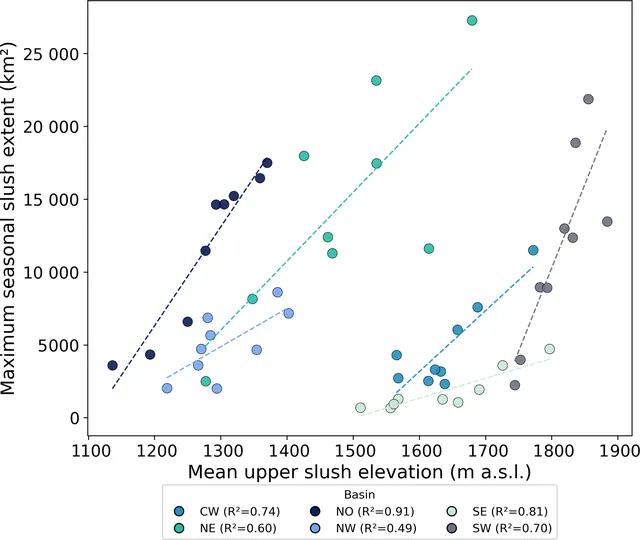
Slush covers far more of Greenland's ice sheet than lakes, channels and crevasses combined
A nine-year satellite map shows slush is the largest mapped surface meltwater feature on the Greenland Ice Sheet, growing and reaching higher in high-melt years.
-
 Observations
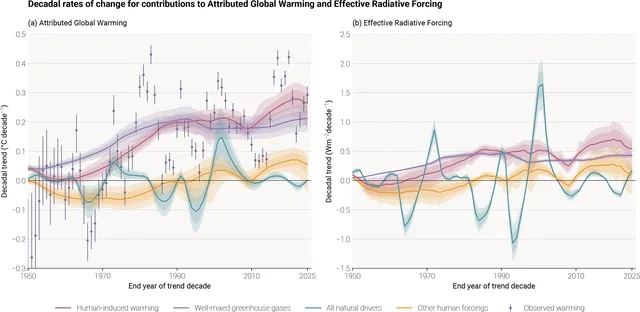
Human-induced warming reached 1.37 °C in 2025, rising 0.27 °C per decade
The fourth annual indicator update finds human-induced warming at 1.37 °C in 2025, rising at 0.27 °C per decade, with emissions at a record high but no longer growing rapidly.
-
 Observations
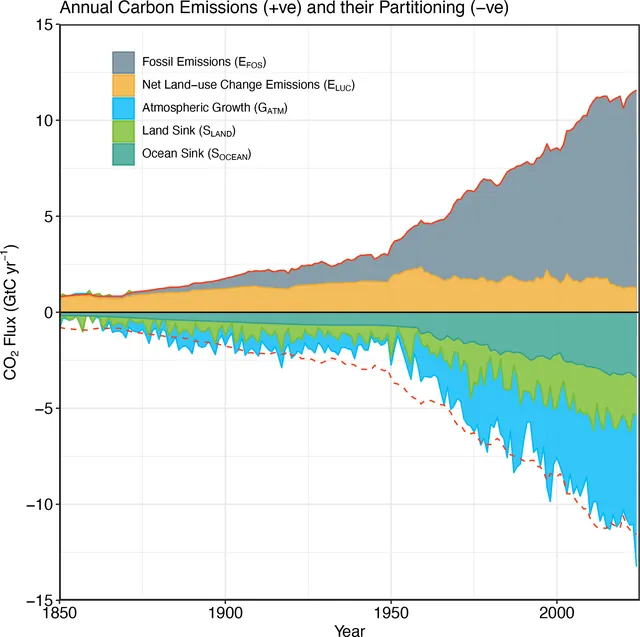
2024 saw record CO2 growth and a large budget gap as fossil emissions rose 1.1 %
Fossil emissions hit a new high in 2024 and are projected to rise again in 2025, while 2024's record atmospheric CO2 growth left the carbon budget about 1.7 GtC out of balance.
-
 Observations
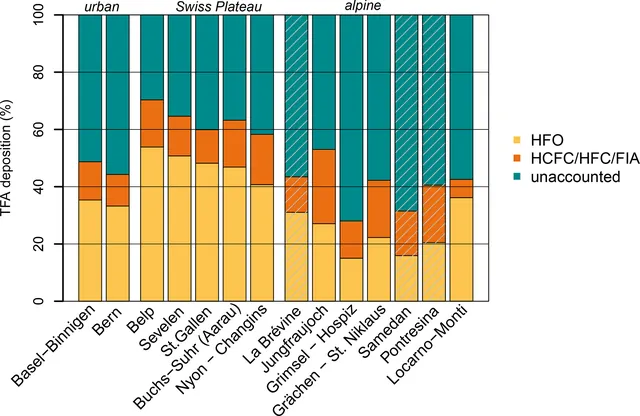
TFA in Swiss rain and rivers rose four to six times since the 1990s; known sources explain part
Swiss rain and river TFA levels have climbed several-fold since 1996/1997, and simulated breakdown of known fluorinated gases explains only about 63 % of the TFA deposited on the Swiss Plateau.
-
 Observations
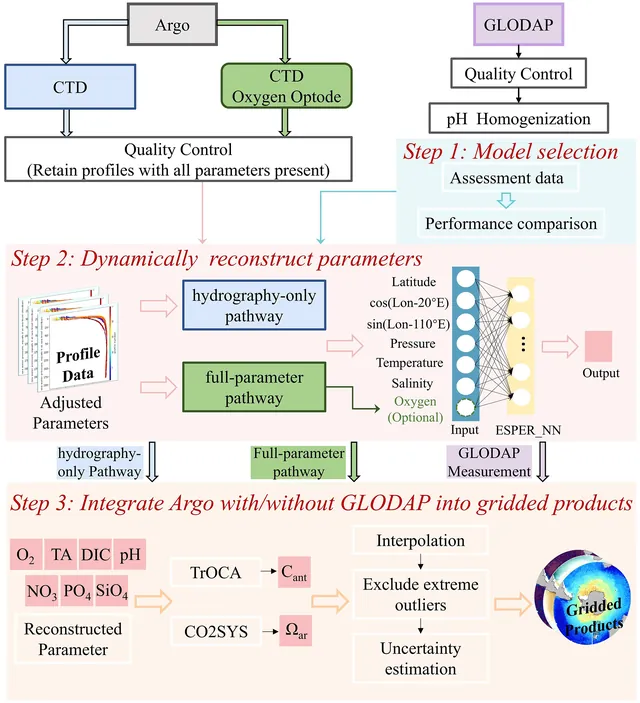
Argo floats and machine learning yield gridded Southern Ocean carbon maps to 5600 m
The authors used a neural network to turn Argo float temperature, salinity and sometimes oxygen into 1°×1° maps of Southern Ocean carbon chemistry, including anthropogenic carbon, with uncertainties.
-
 Observations
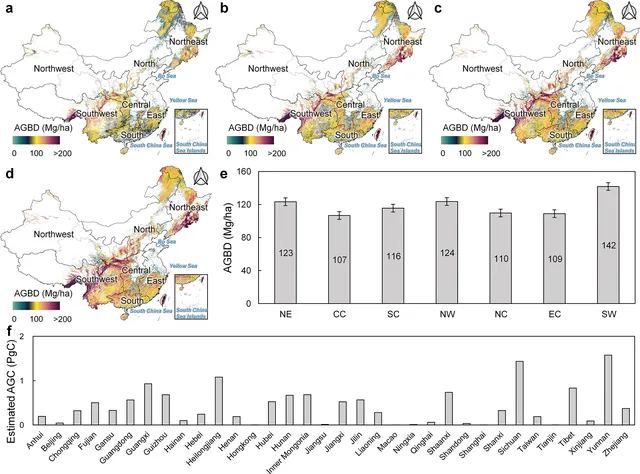
China's forest biomass density rose from 95.74 to 122.69 Mg per hectare between 1985 and 2023
A 30 m annual map of China's forest biomass from 1985 to 2023 shows aboveground carbon stock rising from 5.50 to 13.97 PgC, mostly through growth of existing forest.
-
 Observations
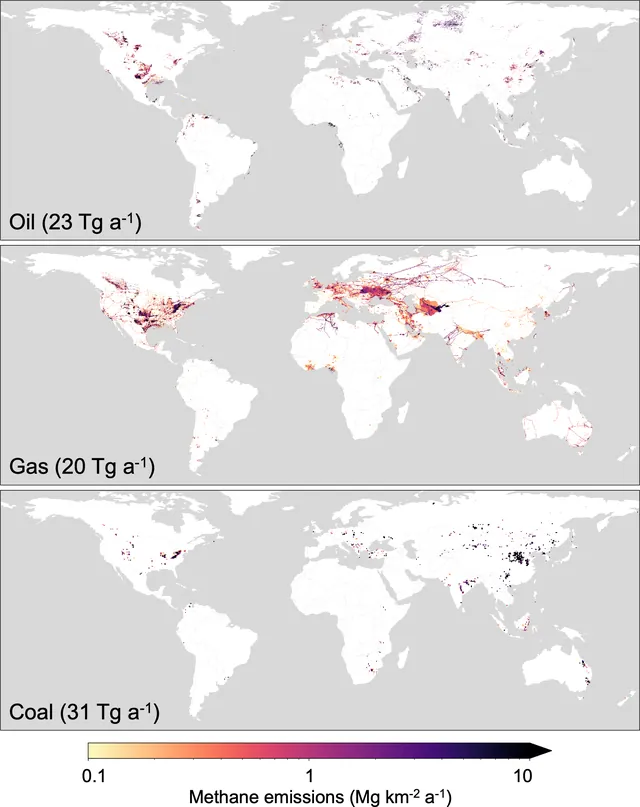
New global methane inventory for oil, gas and coal totals 74 Tg a−1 in 2020
GFEI v3 maps nationally reported 2020 fossil fuel methane emissions onto a 0.1° grid using new infrastructure and coal mine data, and it stays below other inventories and satellite-based estimates.
-
 Observations
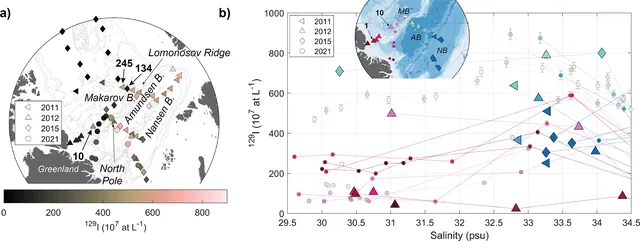
Iodine-129 and uranium-236 track Atlantic and Pacific water shifts in the central Arctic
Two radionuclide tracers show that in 2021 Pacific-influenced surface water met Atlantic-origin water at the Lomonosov Ridge, that this front moved from the Makarov Basin toward the ridge between 2011/2012 and 2015, and that Atlantic layer ages rose from 2015 to 2021 in several regions.
-
 Observations
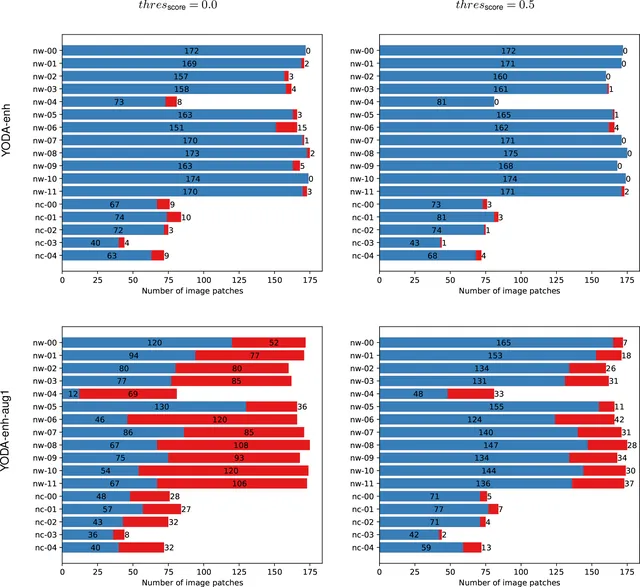
Open Sentinel-1 dataset labels oil slicks and look-alikes in the Eastern Mediterranean
The authors released a labeled set of radar image patches with 3225 oil objects and many look-alike scenes, so oil spill detectors can be tested on a common benchmark.
-
 Observations
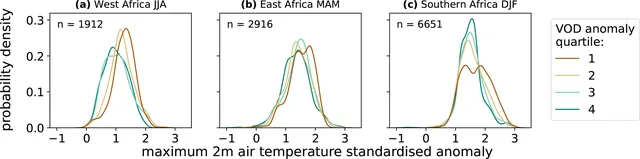
Dry land before a flash drought is linked to stronger heat feedback during it
Satellite data show that flash droughts starting from water-stressed land have stronger surface heating, and in parts of Africa low vegetation water content 1–2 months earlier goes with hotter peaks.
-
 Observations
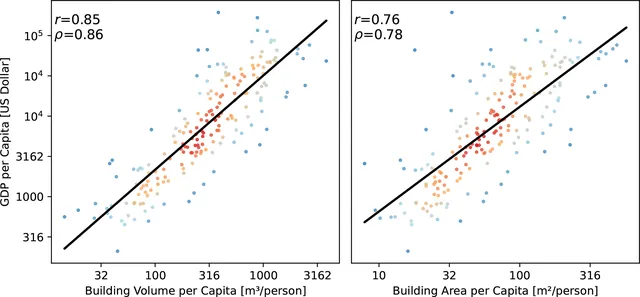
Open global dataset maps 2.75 billion buildings with heights from satellite images
Using only PlanetScope satellite images plus existing footprint data, the authors built the first complete global set of building outlines, 3 m height maps and simple 3D models, with height errors of 1.5 to 8.9 m by continent.
-
 Observations
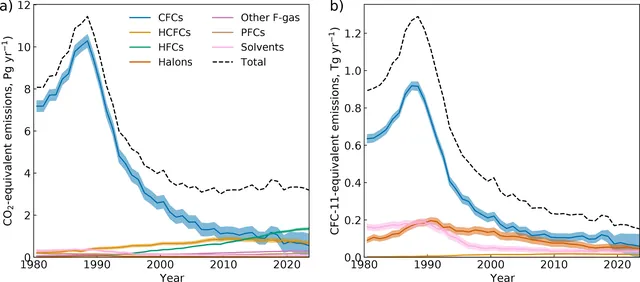
AGAGE data show 2023 emissions and levels of 42 trace gases, with limits
Using AGAGE station measurements and a simple 12-box atmosphere model, the authors publish yearly global emissions and abundances for 42 trace gases through 2023, and explain how they are derived and where they fall short.
-
 Observations
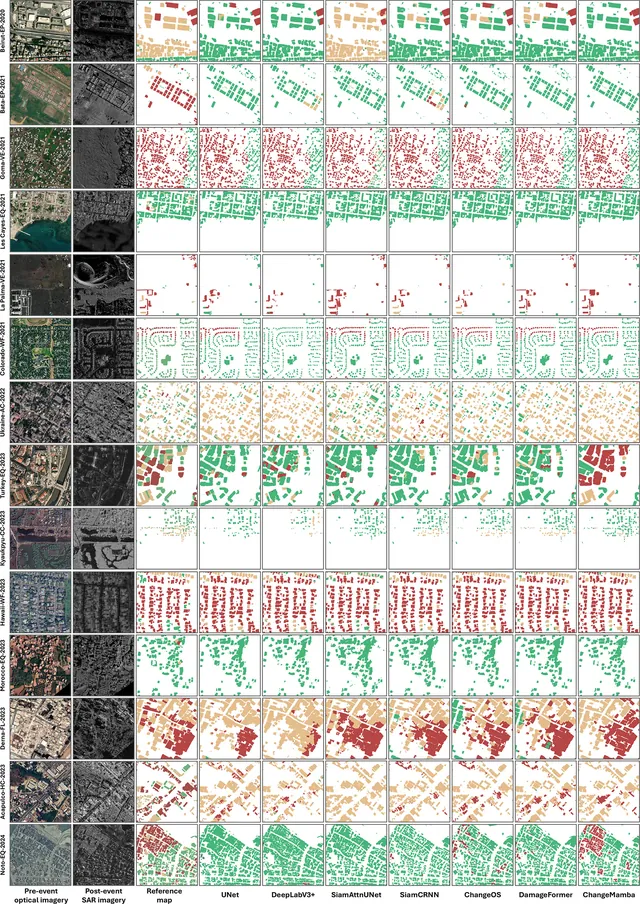
New open dataset pairs pre-event optical and post-event radar images to map building damage
Bright is the first open, global dataset combining pre-disaster optical and post-disaster radar images of buildings, and models trained on it work well within known events but struggle on new ones.
-
 Observations
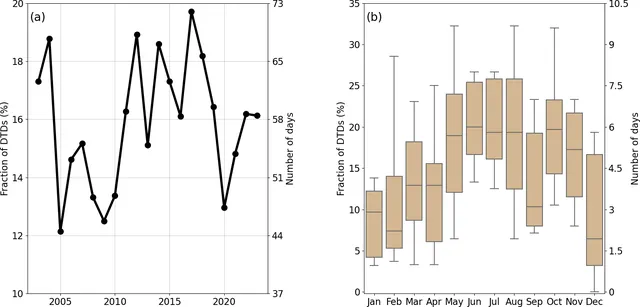
Saharan dust reached Monte Cimone on 15.8 % of days over 21 years, with no trend
Over 2003–2023, Saharan dust reached an Italian mountain station on about 58 days a year, with no trend, and longer summer events brought the largest coarse-particle rises.
-
 Observations
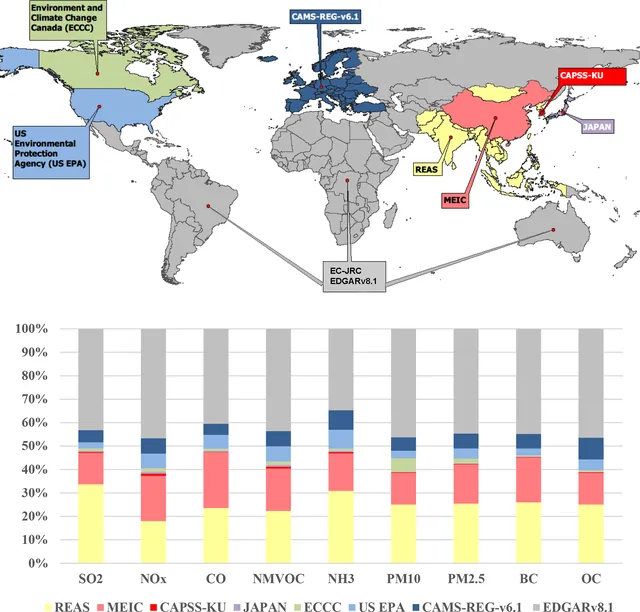
A global air pollutant emission mosaic now covers 2000–2020 at monthly resolution
HTAP_v3.2 blends official regional emission inventories with the EDGAR global inventory into one monthly, gridded dataset for nine air pollutants over 2000–2020.
-
 Observations
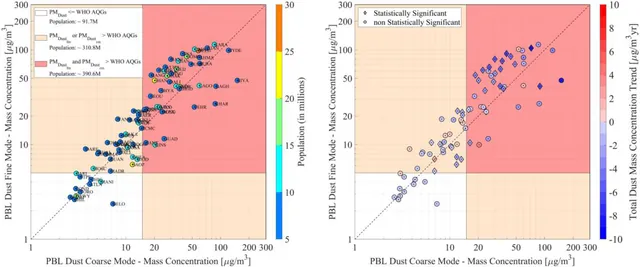
Satellite data show dust above WHO limits in most of 81 large cities
Using 16 years of satellite lidar data, the authors find that dust in the lowest atmospheric layer exceeds WHO annual guidelines for fine particles in 87.7 % of 81 large cities, though dust is mostly declining.
-
 Observations
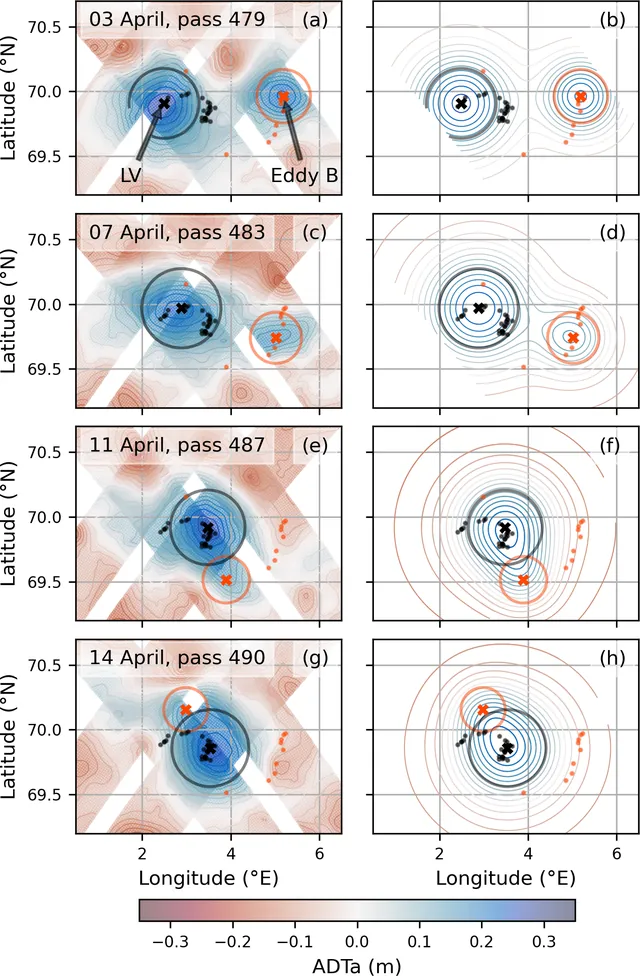
Glider and SWOT satellite watch a smaller eddy merge into the Lofoten Vortex
Combining a glider with SWOT altimetry, researchers saw a smaller, stronger eddy approach, co-rotate with and merge into the Lofoten Vortex in April 2023, spinning it up.
-
 Observations
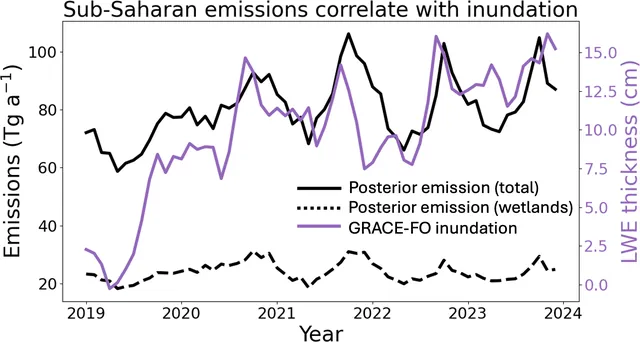
Satellite data show global methane emissions surged in 2020–2021, then fell
Using TROPOMI satellite data, the authors estimate global methane emissions rose from 560 Tg a−1 in 2019 to 587–592 Tg a−1 in 2020–2021, with sub-Saharan African wetlands, especially in South Sudan, likely playing a major role.
-
 Observations
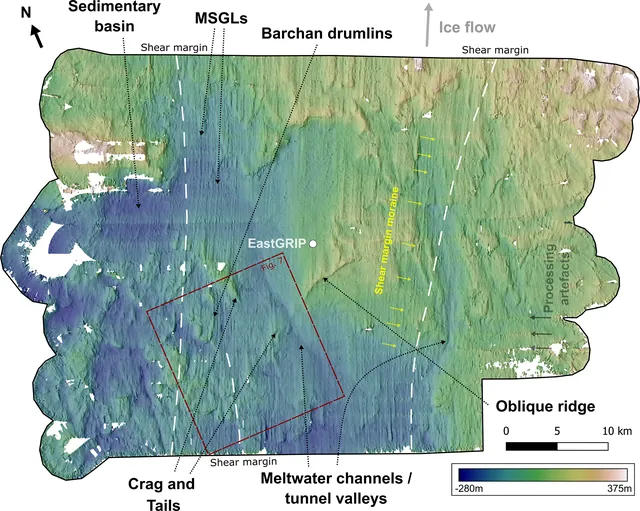
Streamlined bed landforms found under slow ice at the start of the NE Greenland Ice Stream
Swath radar shows long, streamlined bed ridges (mega-scale glacial lineations) beneath ice moving only about 60 m per year near the Northeast Greenland Ice Stream onset, which challenges the idea that they need fast flow.
-
 Observations
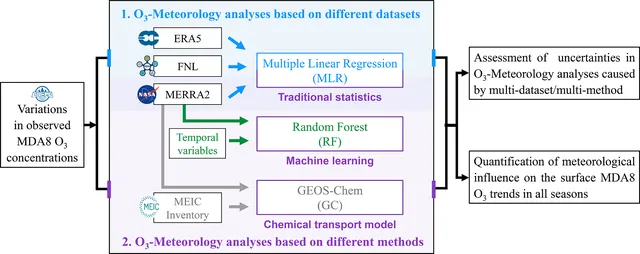
Weather pushed up China's ozone trends in all seasons, but methods disagree most
Across three weather datasets and three methods, meteorology almost always raised China's surface ozone from 2013 to 2022, but the choice of method changes the size of that effect more than the choice of dataset.
-
 Observations
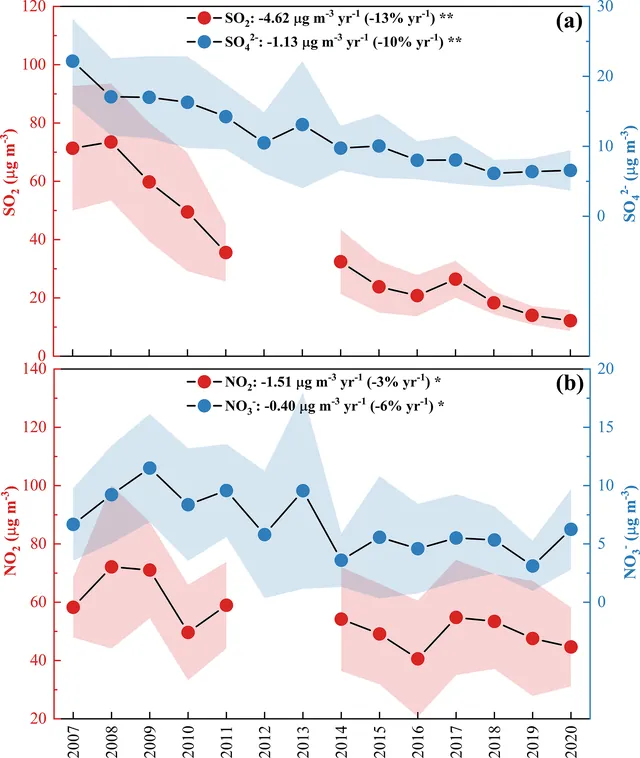
PM2.5 in south China fell 2007–2020 while nitrate's share doubled and aerosol acidity dropped
Winter PM2.5 at a Pearl River Delta background site fell from 87.1 to 34.0 µg m−3 over 14 years, but nitrate dropped more slowly than sulfate, so secondary species and nitrate now matter more.
-
 Observations
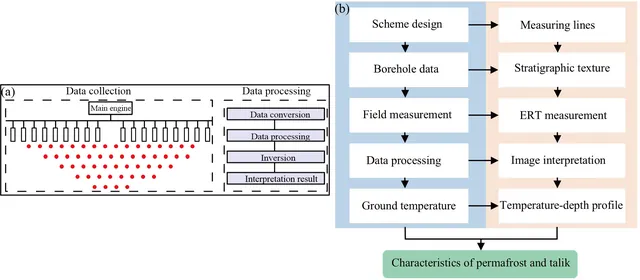
Thermokarst lakes on the Tibetan Plateau thaw permafrost and form through-taliks beneath them
In a Tibetan Plateau lake basin, ground resistivity surveys and borehole temperatures showed that three small thermokarst lakes have thawed the permafrost below them all the way through.
-
 Observations
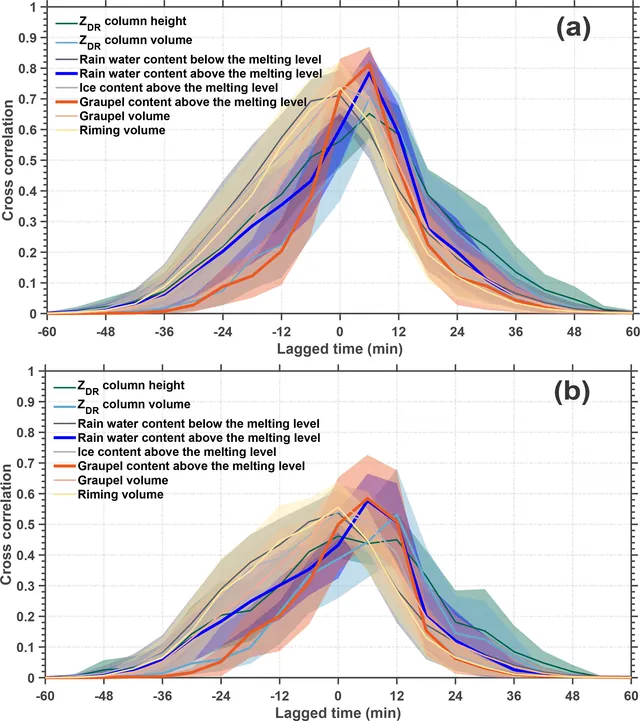
Graupel and supercooled rain predict lightning better than ZDR columns at 6 minutes
In 15 isolated South China thunderstorms, graupel and supercooled rain content gave the best 6-minute lightning forecasts, while ZDR column volume looked better at 12 minutes.
-
 Observations
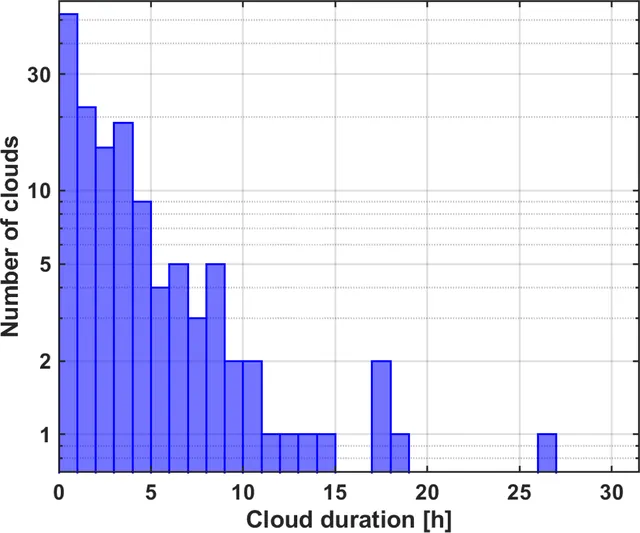
Arctic mixed-phase clouds lasted by constantly forming new droplets, with plentiful ice nuclei
Year-round lidar and radar data from near the North Pole suggest long-lived Arctic mixed-phase clouds persist because new droplets keep forming and ice-nucleating particles never run short.
-
 Observations
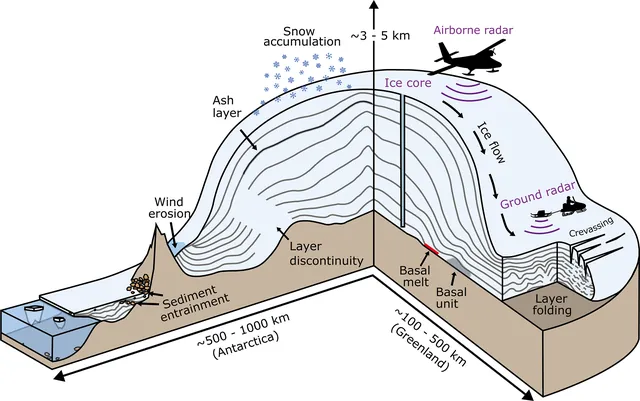
Radar-imaged ice layers could be built into a continent-wide age–depth model of Antarctica
Six decades of radar surveys have recorded dated layers inside Antarctic ice, but only a small part has been traced, and a community effort is needed to turn it into a continent-wide age model.
-
 Observations
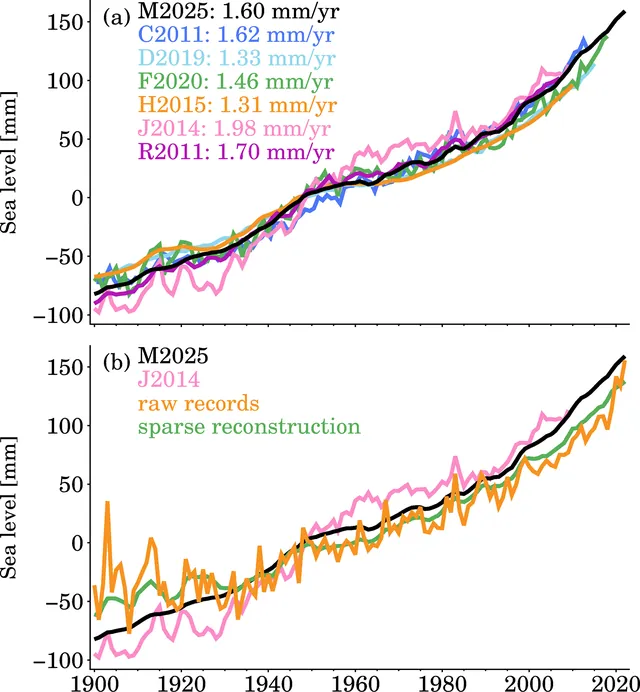
Sea level rebuilt at 945 tide gauges since 1900 shows a rise of 1.75 mm per year
The authors filled the gaps in 945 tide gauge records from 1900 to 2022 with a physics-based method, and the result matches other global sea level curves while following the raw records where they exist.
-
 Observations
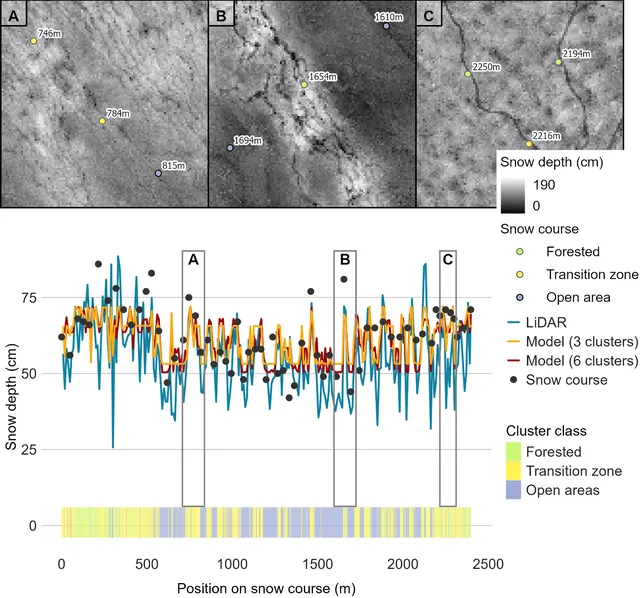
Drone LiDAR and clustering give daily snow depth and SWE maps in Finnish boreal sites
One winter of drone LiDAR surveys, grouped into three snow-pattern clusters and paired with daily sensor data, gave 1 m snow depth and SWE maps with SWE errors of 31–36 mm in two Finnish Lapland sites.
-
 Observations
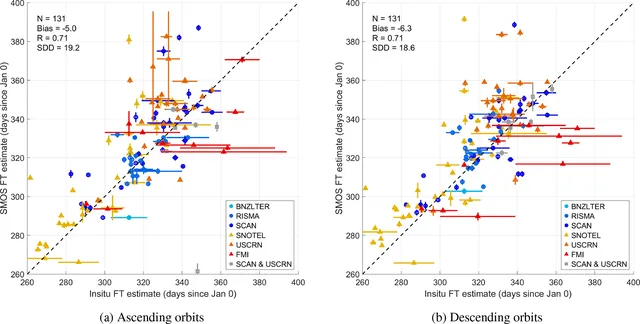
SMOS satellite product detects first autumn soil freezing, but later than ground sensors
The updated SMOS freeze–thaw product tracks when northern soils first freeze in autumn fairly well, with a lag of several days, and works poorly in spring and in areas with radio interference.
-
 Observations
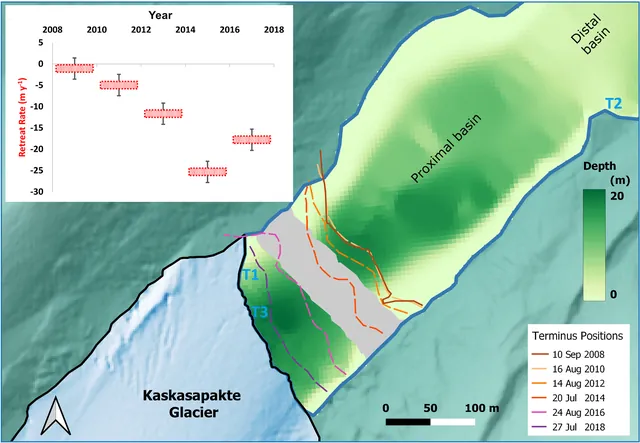
Warm lake water above 4 °C helped an Arctic Swedish glacier retreat quickly
At Kaskasapakte Glacier in Arctic Sweden, lake water warmer than 4 °C carved notches into the ice front and drove calving, and ice lost at the front made up about 30% of volume loss from 2015 to 2019.
-
 Observations
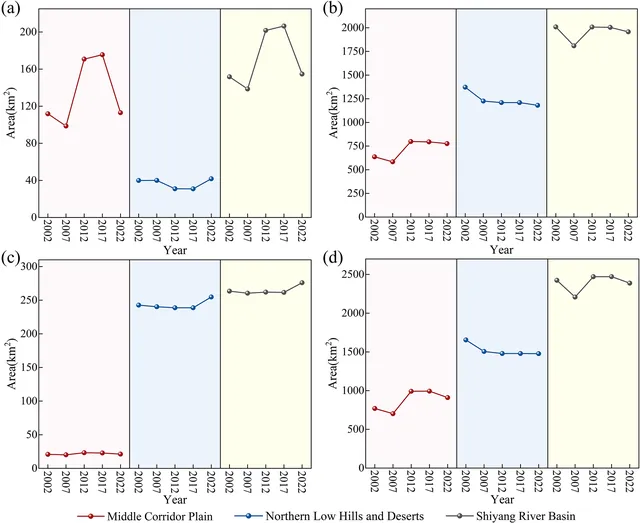
Soil salt area in a dry Chinese river basin held steady while salt severity rose
Satellite maps of the Shiyang River basin from 2002 to 2022 show the salty area changed little overall, but salinization got more severe near reservoirs, irrigated land and downstream water-input zones.