Sea level rebuilt at 945 tide gauges since 1900 shows a rise of 1.75 mm per year
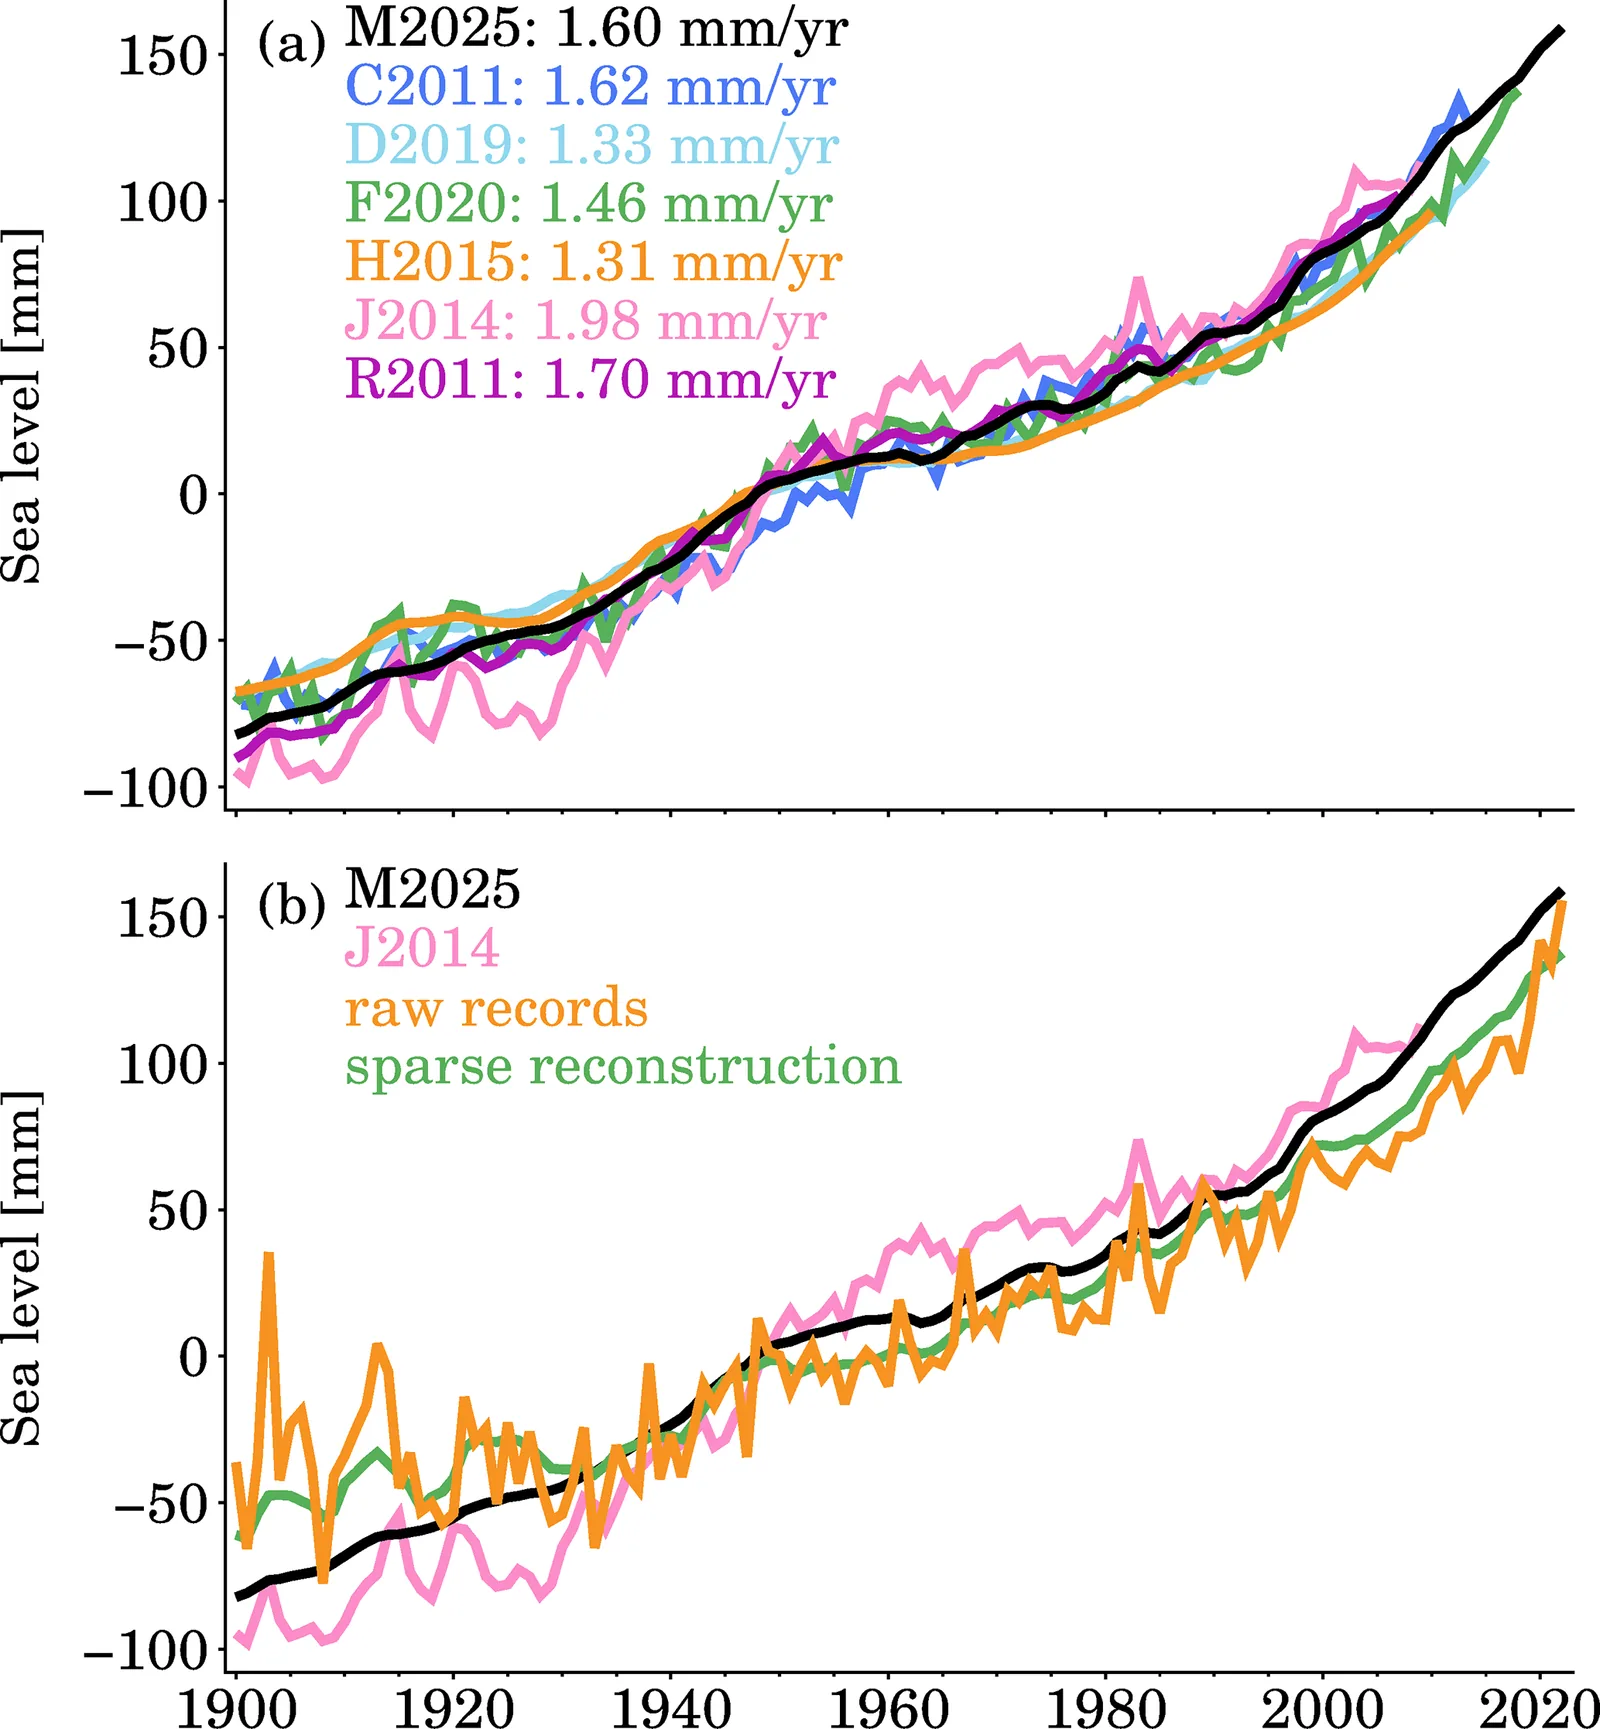
The authors filled the gaps in 945 tide gauge records from 1900 to 2022 with a physics-based method, and the result matches other global sea level curves while following the raw records where they exist.
Why it matters
Tide gauge records have many gaps, which makes local sea level history hard to study. Complete series at the exact gauge sites can support regional sea level work, climate model checks and coastal planning. The 35-member ensemble also lets users judge the spread of possible histories.
What they did
The authors kept 945 gauges from the PSMSL database that have at least 20 years of data between 1900 and 2022. Only 39.3 % of the possible yearly records exist. They used a data assimilation method that combines tide gauge data, sea level from 35 CMIP6 climate models, mass-driven sea level patterns (fingerprints) and glacial isostatic adjustment. A random process corrects local model errors. Each gauge gets 35 reconstructed series, one per climate model. They checked the results against satellite altimetry, other global reconstructions and a local reconstruction called T2024.
Key findings
- The average of the reconstructions gives a global mean sea level rate of 1.75 ± 0.05 mm yr−1 over 1900–2020.
- Over 1900–2007 the rate is 1.60 mm yr−1, close to the 1.62 mm yr−1 of Church and White (2011). Other reconstructions range from 1.31 to 1.98 mm yr−1.
- Over 1993–2022 the reconstruction gives 3.52 mm yr−1, against 3.56 mm yr−1 from satellite altimetry.
- At gauges, the reconstructions follow the raw records where they exist. They spread widely during data gaps, and at one site the spread approaches 1 m by 2022.
- Average local rates match T2024 (1.22 and 1.20 mm yr−1), but individual sites differ by up to 9.25 mm yr−1.
Limitations
- The reconstructions have no year-to-year variability, so they suit trends over periods longer than 30 years, not short periods.
- Earthquake jumps and other anomalies stay in the data. Thirteen gauges were flagged, and the 2011 Tohoku-Oki jump of 680 mm at Ofunato II is one example.
- The ensemble spread probably understates the true uncertainty, because it leaves out measurement error and glacial isostatic adjustment model error.
Glossary
- Data assimilation: A method that combines observations with physical model information to estimate a quantity and fill gaps.
- Sterodynamic sea level: Sea level change caused by ocean temperature, salinity and circulation changes.
- Sea level fingerprint: The uneven pattern of sea level rise that results when land ice and water melt into the ocean.
- Glacial isostatic adjustment: The ongoing rise or sinking of land as Earth still responds to the loss of ice since the Last Glacial Maximum.
Original paper
Reconstructing sea level rise from global 945 tide gauges since 1900
Earth System Science Data · 20 October 2025
AI-generated summary of the original article; changes were made. Check the original before relying on it.