Drone LiDAR and clustering give daily snow depth and SWE maps in Finnish boreal sites
One winter of drone LiDAR surveys, grouped into three snow-pattern clusters and paired with daily sensor data, gave 1 m snow depth and SWE maps with SWE errors of 31–36 mm in two Finnish Lapland sites.
Why it matters
Manual snow courses are sparse in time and space. This approach turns an existing snow course plus at least one daily depth sensor into continuous, high-resolution snow estimates. That could help hydrological forecasting and water management in boreal and sub-arctic areas.
What they did
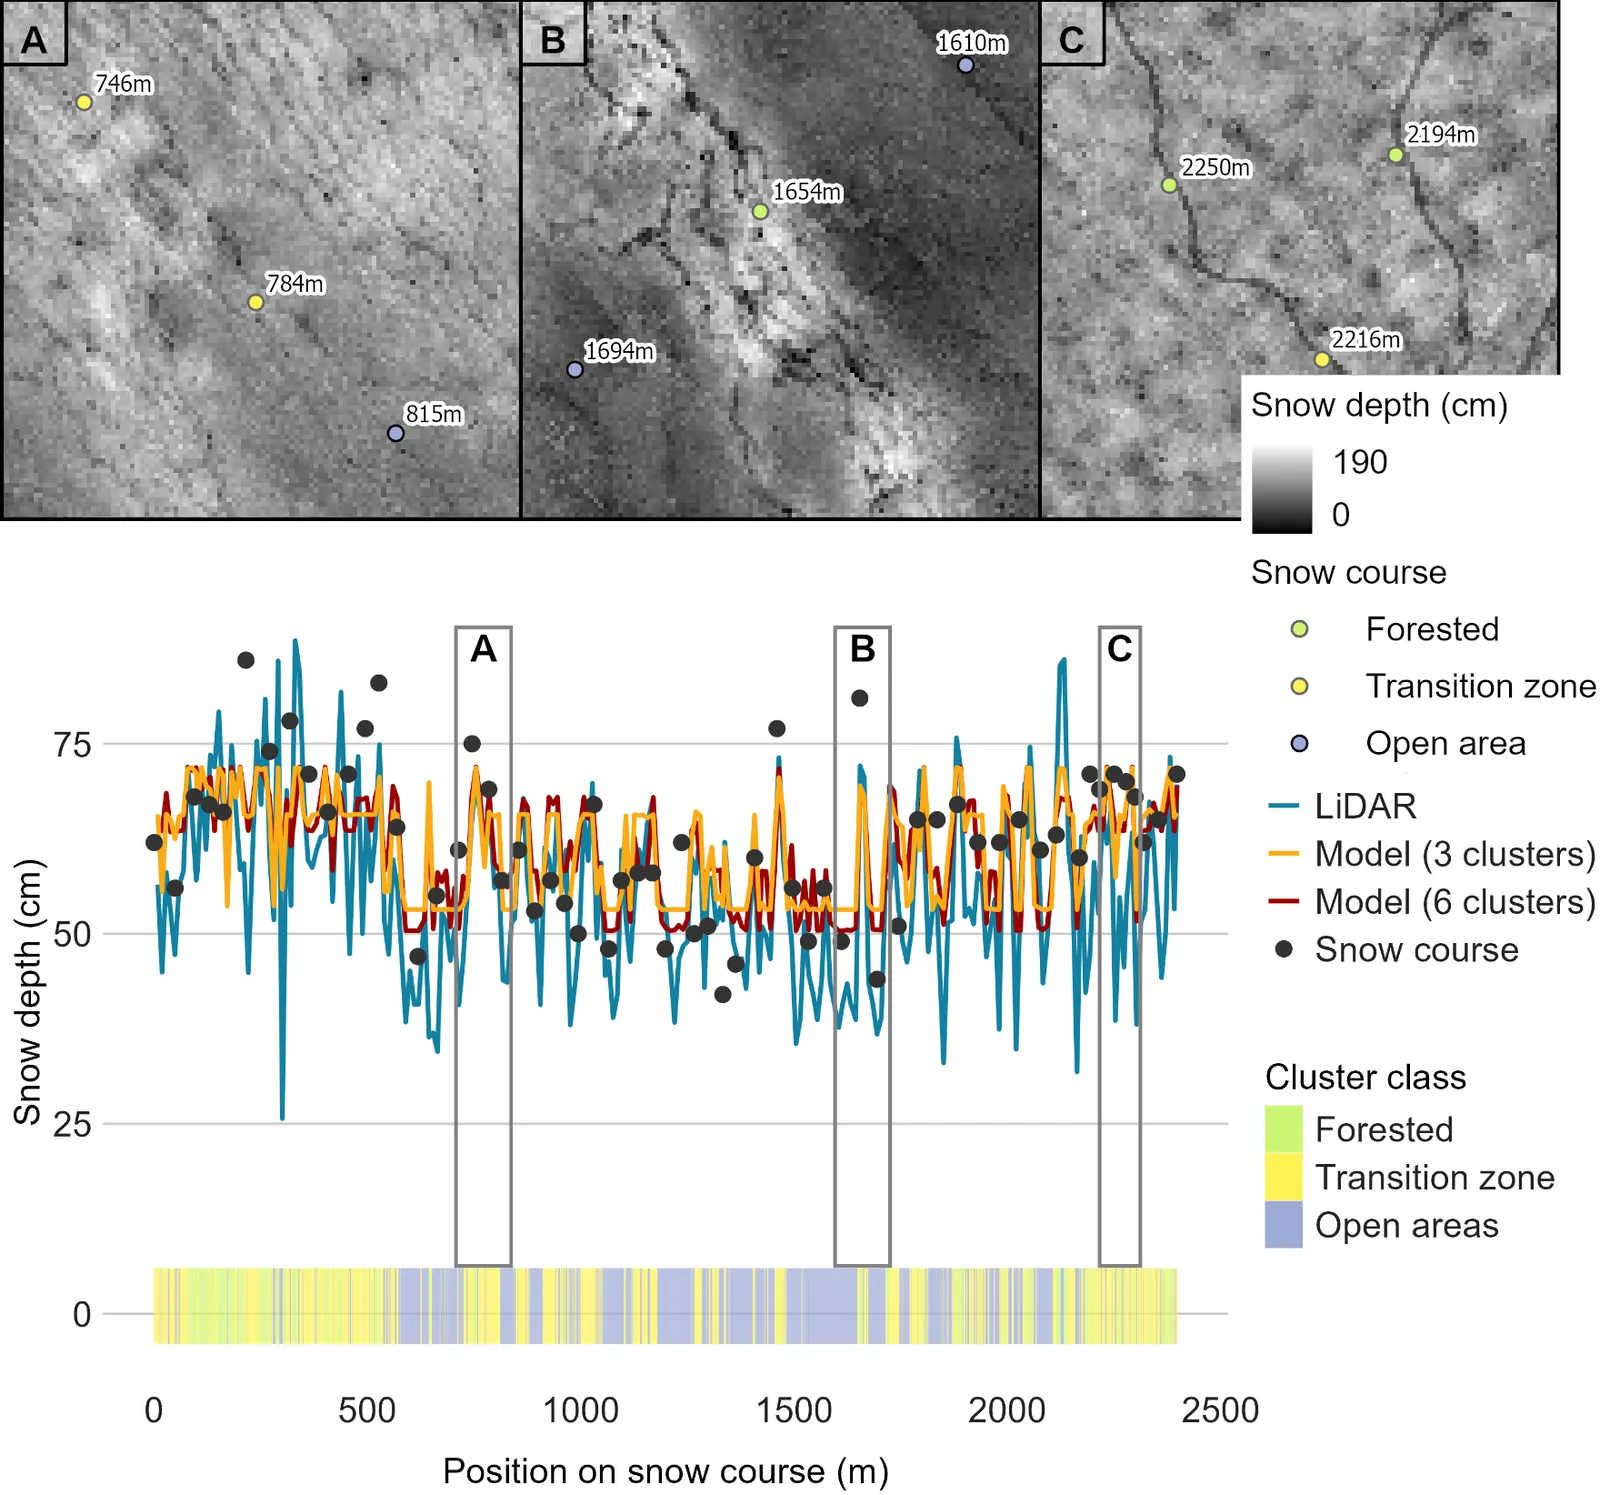
The team flew UAV LiDAR over two sites, Sodankylä and Pallas, in winter 2023–2024. They flew four snow-on surveys and one snow-off survey, and took manual snow course measurements within 6 h of each flight. They fed the snow depth maps into ClustSnow, a machine learning workflow that uses k-means and random forest. It grouped the landscape into three clusters. They scaled the daily sensor and snow course depths across each cluster, then converted depth to SWE with a snow density model. They checked the results against snow course data and the LiDAR maps.
Key findings
- The three clusters matched land cover: forest, transition zones with bushes and forest gaps, and open peatland. Each had different snow accumulation and melt.
- Modelled SWE at the snow courses had RMSE of 35.6 mm in Pallas and 33.1 mm in Sodankylä. Modelled snow depth error was 5.8 cm in Pallas and 8.0 cm in Sodankylä.
- Compared with the full LiDAR maps, model RMSE was 6.2 to 11.0 cm in Sodankylä and 18.7 to 24.7 cm in Pallas. The largest errors were in a flooding mire and on wind-drifted slopes.
- LiDAR accuracy was worst in May, when meltwater and flooding disturbed the laser returns. Sodankylä trueness was best in April (0.9 cm).
- Clusters built from one winter reproduced peak SWE and its timing in earlier Pallas winters, with some over- and underestimates.
Limitations
- The clusters come from one unusual winter with above-average snow, and other kinds of winters may not fit them. The authors say another year is needed to verify them.
- Three clusters miss extreme snow depths. The sensitivity analysis found six clusters gave the best accuracy. Pallas has only one reference sensor, and its snow course data likely biased the results.
- Flooded mires reduced the accuracy of both LiDAR and manual measurements, especially in May.
Glossary
- SWE (snow water equivalent): The depth of water you would get if the snowpack melted.
- ClustSnow: A machine learning workflow that groups places with similar snow depth patterns and uses those groups to spread point measurements across an area.
- Snow course: A fixed route where snow depth and density are measured by hand, usually every few weeks.
- RMSE: Root mean square error, a typical size of the difference between modelled and measured values.
Original paper
UAV LiDAR surveys and machine learning improve snow depth and water equivalent estimates in boreal landscapes
The Cryosphere · 16 October 2025
AI-generated summary of the original article; changes were made. Check the original before relying on it.