AGAGE data show 2023 emissions and levels of 42 trace gases, with limits
Using AGAGE station measurements and a simple 12-box atmosphere model, the authors publish yearly global emissions and abundances for 42 trace gases through 2023, and explain how they are derived and where they fall short.
Why it matters
These data sets feed ozone and climate assessments, and they let researchers check reported emissions against what the air shows. A single paper now documents the method in detail. Users can see what the estimates can and cannot support.
What they did
The authors took monthly baseline measurements from seven background stations, plus archived air samples for some gases. They fed these into a 12-box model of the atmosphere. A Bayesian inverse method then estimated global emissions and mole fractions, starting from prior emission estimates and constraining emission growth. Uncertainties combine measurement, model, calibration and lifetime errors.
Key findings
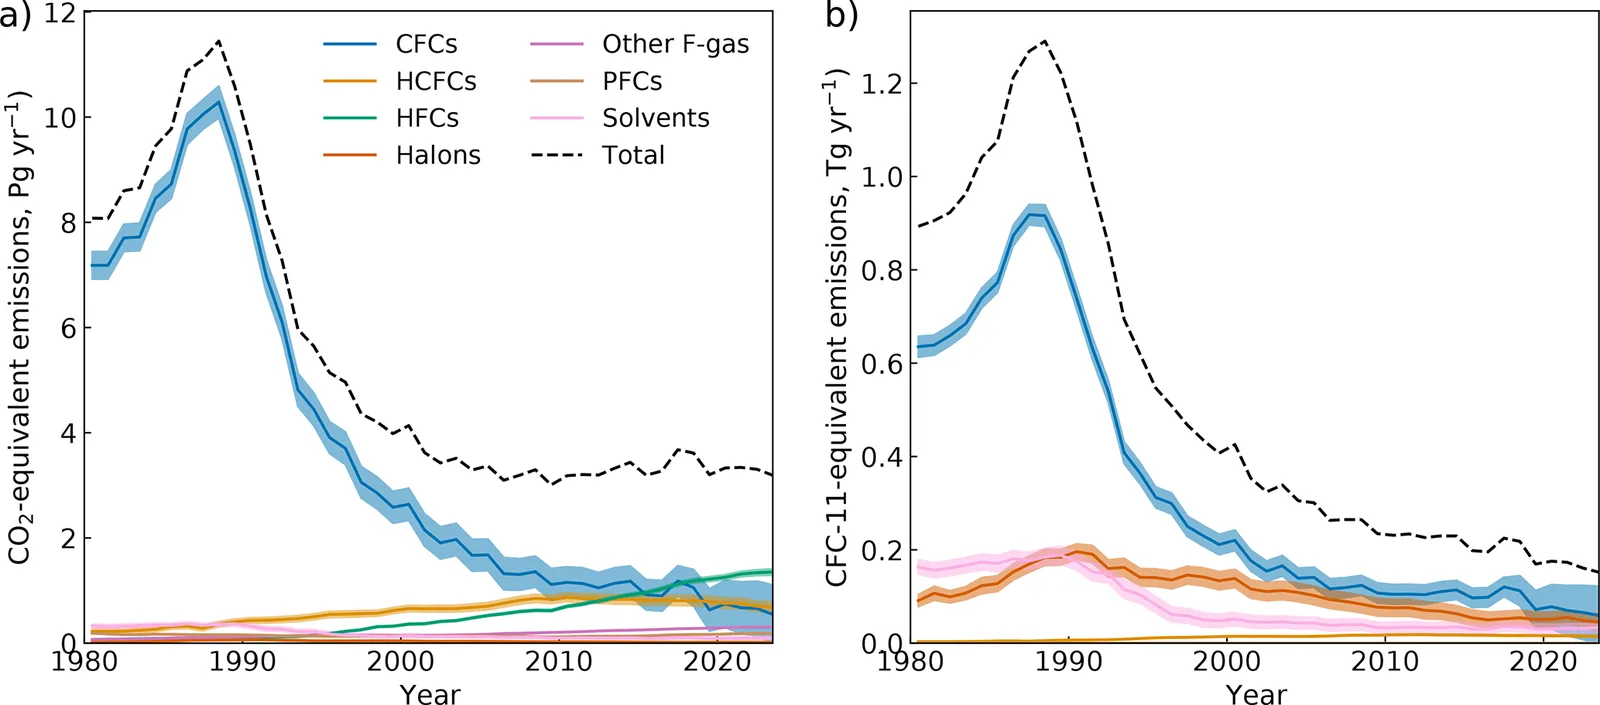
- Synthetic greenhouse gas emissions were 3.2 ± 0.6 Pg CO2-eq in 2023 and have changed little over the last 20 years of the record.
- Emissions of ozone-depleting synthetic gases were 152 ± 66 Gg CFC-11-eq in 2023, the lowest since the measurement-derived record began.
- Equivalent effective chlorine has fallen since its 1994 peak, to 2920 ± 30 ppt in 2023, while direct radiative forcing of synthetic gases reached 411 ± 5 mW m−2.
- Methane reached 1917 ± 10 ppb with emissions of 579 ± 73 Tg yr−1 in 2023. Nitrous oxide reached 337 ± 2 ppb with emissions of 29 ± 3 Tg yr−1.
- Dichloromethane roughly doubled between 2008 and 2023, reaching 41.5 ± 1.3 ppt.
Limitations
- The coarse box model cannot give reliable regional or semihemispheric emissions. Repeating yearly meteorology and OH can create false year-to-year changes.
- The baseline filter can be unreliable at record ends, after instrument downtime, or at polluted or monsoon-affected sites. Isomers such as CFC-113 and CFC-113a are not separated.
- Emissions from the last two years or so are preliminary, and short-lived gases may carry unaccounted biases.
Glossary
- 12-box model: A simple model that splits the atmosphere into 12 boxes by latitude and height and tracks how gases move and are lost between them.
- Inverse method: A way to work backward from measured concentrations to the emissions that best explain them.
- Baseline mole fraction: The gas level in clean, well-mixed air, with nearby pollution events removed.
- Equivalent effective chlorine: A measure of ozone-depleting potential: chlorine atoms per molecule times the gas’s abundance, summed over gases.
Original paper
Global emissions and abundances of chemically and radiatively important trace gases from the AGAGE network
Earth System Science Data · 27 November 2025
AI-generated summary of the original article; changes were made. Check the original before relying on it.