Weather pushed up China's ozone trends in all seasons, but methods disagree most
Across three weather datasets and three methods, meteorology almost always raised China's surface ozone from 2013 to 2022, but the choice of method changes the size of that effect more than the choice of dataset.
Why it matters
Studies of how weather drives ozone trends in China often disagree, and the reasons were not measured before. This work shows where estimates can be trusted (spring, winter, and the east coast) and where they cannot (summer and autumn, especially northern China). It also points to which dataset and method are safer to use.
What they did
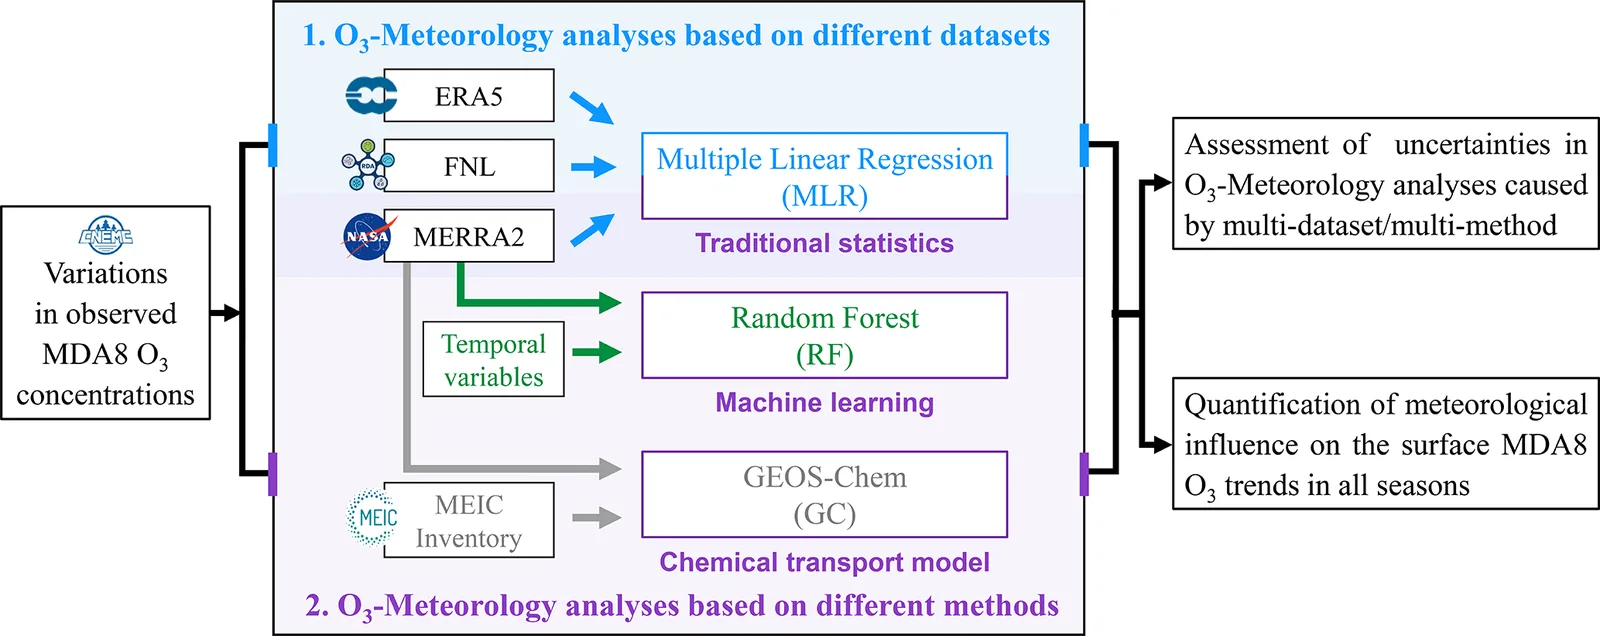
The authors used hourly ozone records from over 1000 monitoring stations in China for 2013–2022, summarised as the daily maximum 8-hour average. They separated the weather-driven part of ozone trends using three reanalysis datasets (ERA5, MERRA2, FNL) with multiple linear regression. They then compared three methods (multiple linear regression, random forest, GEOS-Chem model) on the same MERRA2 data. They measured disagreement with the coefficient of variation (CV), the spread divided by the mean.
Key findings
- Observed national ozone rose in every season: +1.31 ppb yr−1 in spring, +0.93 in summer, +0.79 in autumn and +0.80 in winter.
- Across datasets, the weather-driven trend was largest and most consistent in spring (+0.55 ppb yr−1, CV = 0.25).
- The FNL dataset almost always gave larger weather-driven trends than ERA5 and MERRA2, which the authors link to its poor estimate of boundary layer height.
- Across methods, agreement was best in winter (CV = 0.40) and worst in summer (CV = 2.00). GEOS-Chem gave smaller trends, partly because it simulated higher ozone before 2018.
- Differences between methods were larger than differences between datasets. Estimates were most uncertain in northern China, and especially in Beijing-Tianjin-Hebei in summer and autumn.
Limitations
- Reanalysis datasets have built-in uncertainties from their physical parameterizations and resolution.
- Random forest cannot resolve chemical mechanisms and depends on which predictors are chosen. GEOS-Chem carries over errors from emission inventories and chemistry, and it overestimates ozone in warm seasons.
- Only three datasets and three methods were tested, and the period ends in 2022, which includes COVID-19 effects and weaker meteorological effects after 2019.
Glossary
- MDA8: Maximum daily 8-hour average ozone concentration, a standard air quality measure.
- Coefficient of variation (CV): The standard deviation divided by the mean. A higher value means the estimates agree less.
- Reanalysis: A gridded record of past weather made by combining observations with a weather model.
- Planetary boundary layer height (PBLH): The height of the lowest part of the atmosphere, which is shaped by contact with the ground.
Original paper
Meteorological influence on surface ozone trends in China: assessing uncertainties caused by multi-dataset and multi-method
Atmospheric Chemistry and Physics · 27 October 2025
AI-generated summary of the original article; changes were made. Check the original before relying on it.