A global air pollutant emission mosaic now covers 2000–2020 at monthly resolution
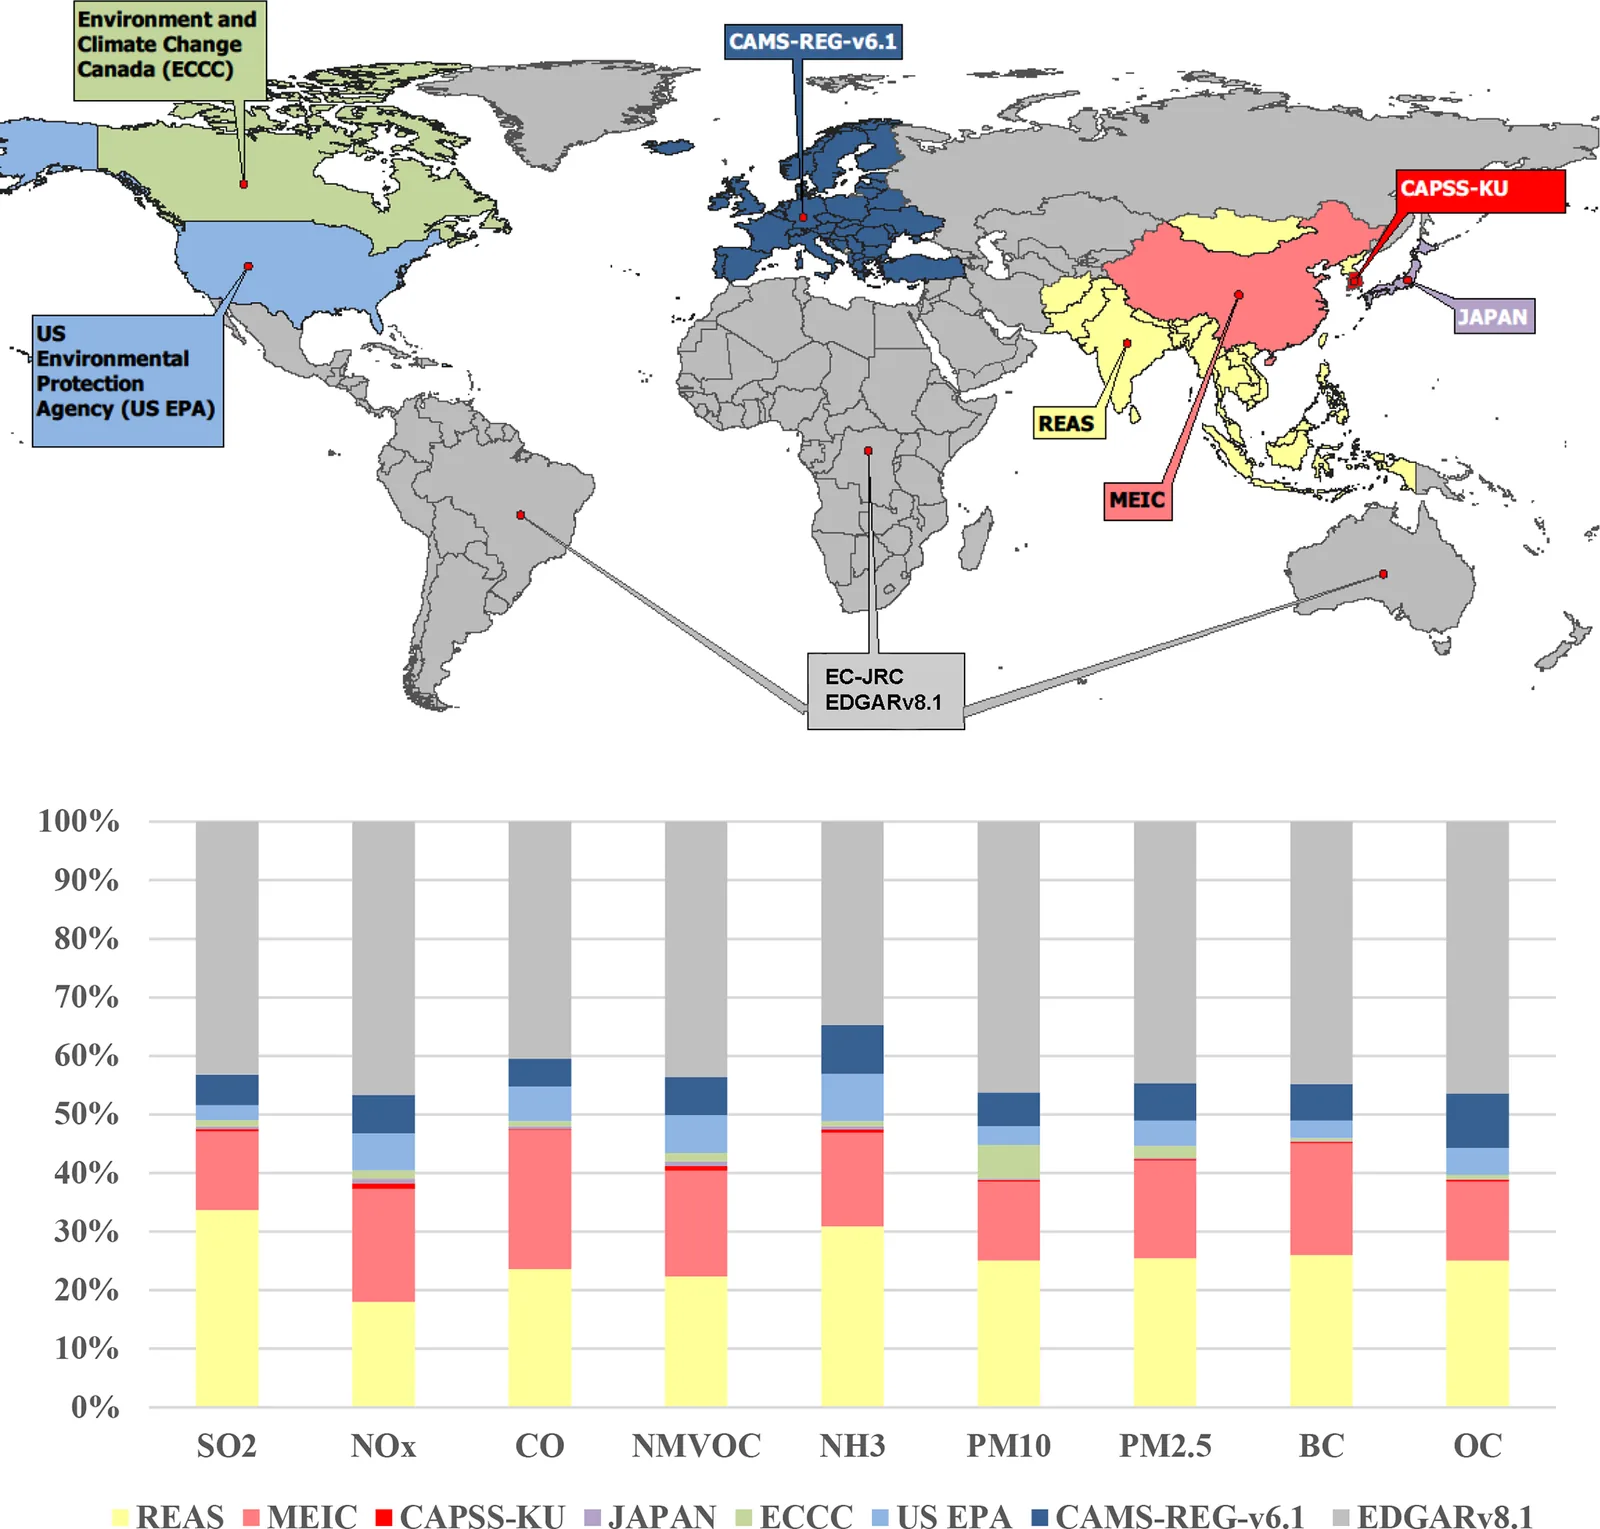
HTAP_v3.2 blends official regional emission inventories with the EDGAR global inventory into one monthly, gridded dataset for nine air pollutants over 2000–2020.
Why it matters
Air quality modellers get one consistent input that keeps local spatial detail from official inventories and fills gaps with a global one. The 20-year record lets users study how emissions changed across regions and sectors. The 2019 to 2020 drop also shows how emissions responded to COVID-19 restrictions and shipping fuel rules.
What they did
The authors combined seven regional inventories covering North America, Europe and parts of Asia, including China, Japan and South Korea. They filled the rest of the world, plus shipping and aviation, with EDGARv8.1. They put all data on a 0.1 × 0.1° grid with monthly values, split into 16 sectors, for SO2, NOx, CO, NMVOC, NH3, PM10, PM2.5, BC and OC. Where inventories ended before 2020, they extended them using EDGAR trends.
Key findings
- Global SO2 emissions fell from 98.9 to 58.3 Mt between 2000 and 2020, while Southern Asia, South-East Asia and Pacific, and Africa rose.
- Global NOx rose from 108.2 Mt in 2000 to 122.1 Mt in 2011, then fell to 113.6 Mt in 2018. The paper links the decline to stabilisation and reduction of Chinese emissions.
- Global NMVOC rose from 116.1 Mt to 146 Mt and NH3 from 43.3 Mt to 55.3 Mt between 2000 and 2018.
- From 2019 to 2020, NOx fell 8.5 % and SO2 fell 16.3 %. The SO2 drop was mostly due to International Maritime Organisation regulations. NH3 rose 1.9 %.
- Residential emissions peak in each hemisphere’s cold season, and agricultural emissions show strong regional seasonality.
Limitations
- No full uncertainty analysis was done. Differences between EDGAR and the mosaic serve only as a rough proxy and may understate uncertainty.
- Most official inventories use the same monthly profile for every year, and regions filled by EDGAR probably have higher uncertainty. Africa and South America have no regional inventories.
- Users should avoid double-counting agricultural waste burning with fire inventories, and agricultural soil NMVOC and NOx with natural emission models such as MEGAN. Wildfires are excluded, and NOx is not split into NO, NO2 and HONO.
Glossary
- Emission mosaic: A single dataset stitched together from several regional inventories, with a global inventory filling the gaps.
- EDGAR: The Emissions Database for Global Atmospheric Research, a globally consistent inventory used here as the gap-filler.
- NMVOC: Non-methane volatile organic compounds, a group of gases that help form ozone.
- Gap-filling: Using one inventory’s data where another provides no data for a region, sector or pollutant.
Original paper
The HTAP_v3.2 emission mosaic: merging regional and global monthly emissions (2000–2020) to support air quality modelling and policies
Earth System Science Data · 7 November 2025
AI-generated summary of the original article; changes were made. Check the original before relying on it.