Satellite data show dust above WHO limits in most of 81 large cities
Using 16 years of satellite lidar data, the authors find that dust in the lowest atmospheric layer exceeds WHO annual guidelines for fine particles in 87.7 % of 81 large cities, though dust is mostly declining.
Why it matters
Many large cities have few or no ground air-quality monitors. Satellite-based dust estimates can fill that gap for health planning. The authors expect more people to live in cities with dust above guidelines by the 2030s, even where dust levels fall.
What they did
They used a satellite lidar dust record (ESA LIVAS, built from CALIPSO) that splits dust into fine and coarse modes. They averaged all overpasses within 100 km of each of 81 cities with more than 5 million people, for December 2006 to November 2022. They took values within the boundary layer, fitted linear trends, and extended the trends to the 2030s. They compared trend signs with ground sunphotometer data and estimated health risk with standard exposure-response formulas.
Key findings
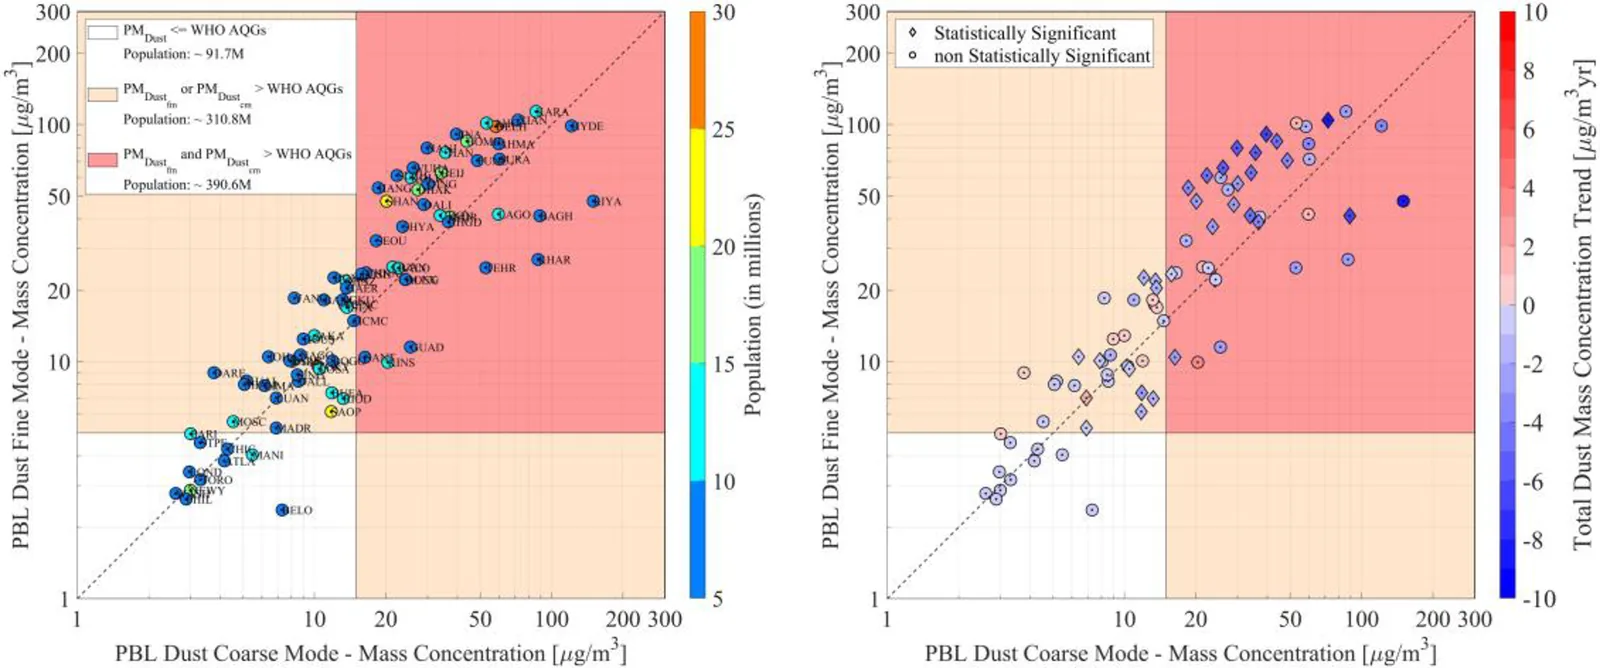
- Fine-mode dust exceeds the WHO annual PM2.5 guideline in 71 of 81 cities (87.7 %). Coarse-mode dust exceeds the PM10 guideline in 40 cities (49.4 %).
- About 701.4 million of roughly 807.9 million city residents are exposed to dust above WHO guidelines.
- Dust is falling in most cities: coarse mode in about 74.1 % and fine mode in about 86.4 %. Most of these trends are not statistically significant.
- Projections to the 2030s put about 856.5 million people above the guidelines. Dust is expected to fall in Asia, Europe and the Americas but rise in Africa.
- Risk is highest in Karachi, where the attributable fraction reaches up to 40.6 % for cardiopulmonary mortality and 54.1 % for lung cancer. Riyadh has the highest coarse-mode risk, with an attributable fraction up to 10.6 %.
Limitations
- The satellite fine-mode dust tends to be underestimated at high dust levels. Trend signs agree with ground sunphotometer data in only about 61.8 % of the 34 cities compared.
- Projections simply extend the 2007–2022 linear trends. They become less reliable the further they run beyond the data.
- The satellite splits fine and coarse dust at 1 µm, but WHO guidelines use 2.5 µm and 10 µm, so the authors use the PM2.5 and PM10 limits as stand-ins. The authors also say that linking dust trends to regulation would be speculative.
Glossary
- Planetary boundary layer (PBL): The lowest part of the atmosphere, where air is mixed by turbulence and most human activity occurs.
- WHO air quality guideline (AQG): The World Health Organization’s recommended limits on particle concentrations, such as 5 µg m−3 annual mean for PM2.5 and 15 µg m−3 for PM10.
- CALIPSO/CALIOP: A satellite lidar that measures vertical profiles of aerosols and can tell dust from other particles by how it scatters light.
- Attributable fraction: The share of disease cases that could be avoided if concentrations fell to a target level.
Original paper
Atmospheric dust and air quality over large-cities and megacities of the world
Atmospheric Chemistry and Physics · 5 November 2025
AI-generated summary of the original article; changes were made. Check the original before relying on it.