China's forest biomass density rose from 95.74 to 122.69 Mg per hectare between 1985 and 2023
A 30 m annual map of China's forest biomass from 1985 to 2023 shows aboveground carbon stock rising from 5.50 to 13.97 PgC, mostly through growth of existing forest.
Why it matters
The dataset gives a spatially detailed, year-by-year record of forest carbon in China, which survey-based and coarse products cannot offer. It lets analysts separate carbon gains from forest growth and from forest expansion, and locate where losses occurred. The authors say it is best used at regional to national scales, not for single plots.
What they did
The authors trained a residual neural network on 72 150 spaceborne lidar (GEDI) biomass samples from 2019–2021. Inputs were Landsat imagery, tree cover, climate, terrain and location. They applied the model to every year from 1985 to 2023 and estimated per-pixel uncertainty. They checked results against GEDI, 2109 field plots, provincial forest inventory statistics, and satellite productivity and vegetation optical depth records.
Key findings
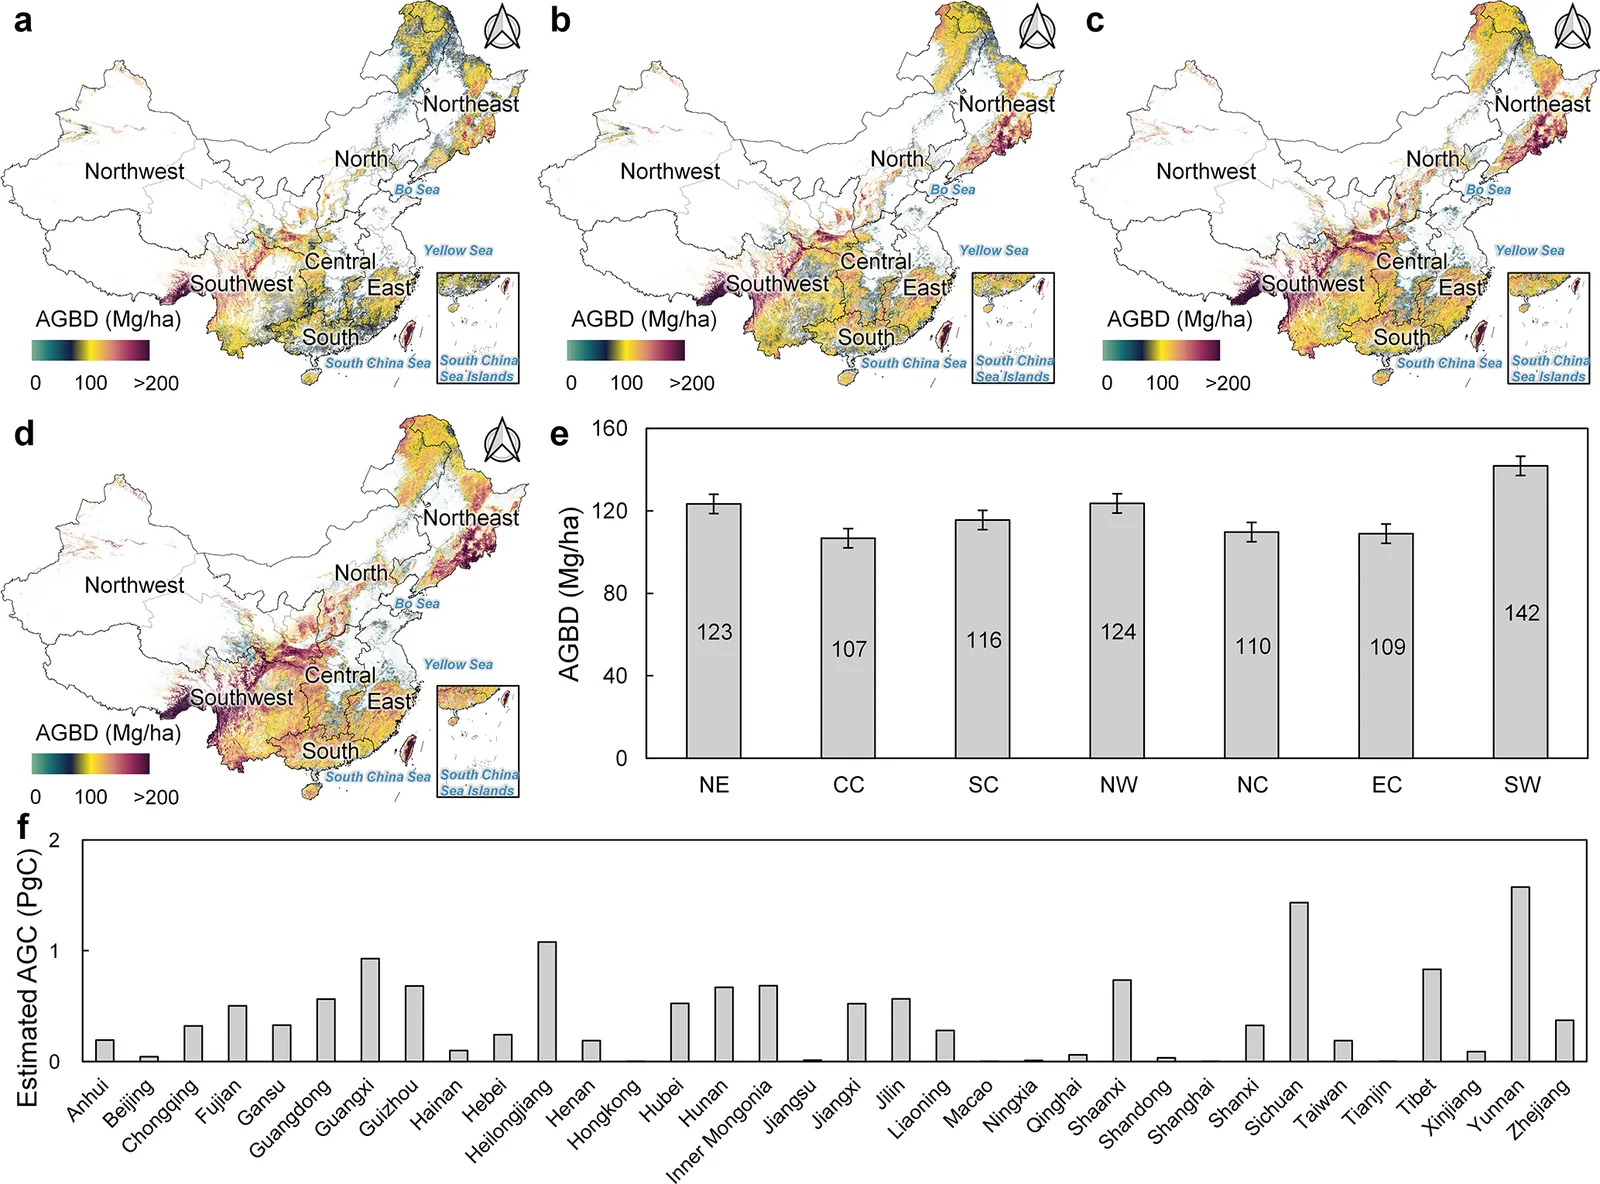
- Average forest biomass density rose from 95.74 ± 11.30 Mg ha−1 in 1985 to 122.69 ± 13.94 Mg ha−1 in 2023, a 28.1 % increase.
- Aboveground carbon stock rose from 5.50 ± 0.23 PgC to 13.97 ± 0.87 PgC, a net sink of 0.22 ± 0.01 PgC yr−1 that offset 11.5 %–14.9 % of fossil fuel and industrial emissions.
- Forest growth gave 65.1 % (5.75 PgC) of the carbon gain and forest expansion gave 34.9 % (3.09 PgC).
- Forest loss caused 52.23 % of carbon reductions and tree cover loss caused 47.77 %, mostly in northern and northeastern China.
- Against GEDI the model reached R2 of 0.91 and RMSE of 16.49 Mg ha−1. Against field plots it reached R2 of 0.63 and RMSE of 68.26 Mg ha−1, with a bias of -19.87 Mg ha−1.
Limitations
- Optical signals saturate in dense forest, so biomass is underestimated in high-biomass stands. The field-plot bias was -19.87 Mg ha−1, and rainforest regions were hardest.
- Results depend on the 20 % tree-cover forest definition and a fixed 0.5 biomass-to-carbon factor. GEDI lacks local calibration data in China.
- Field validation used strictly screened plots from 1978–2008. Raw plots would likely give much lower correlations because of scale mismatch.
Glossary
- Aboveground biomass density (AGBD): The dry mass of living plant material above ground per hectare, in Mg ha−1.
- GEDI: A lidar instrument on the International Space Station that gives footprint-level biomass estimates.
- ResNet: A neural network with skip connections that make deep models easier to train.
- Vegetation optical depth (VOD): A microwave measure of canopy structure and water content that tracks biomass.
Original paper
Dynamics of China's forest carbon storage: the first 30 m annual aboveground biomass mapping from 1985 to 2023
Earth System Science Data · 10 December 2025
AI-generated summary of the original article; changes were made. Check the original before relying on it.