Satellite data show global methane emissions surged in 2020–2021, then fell
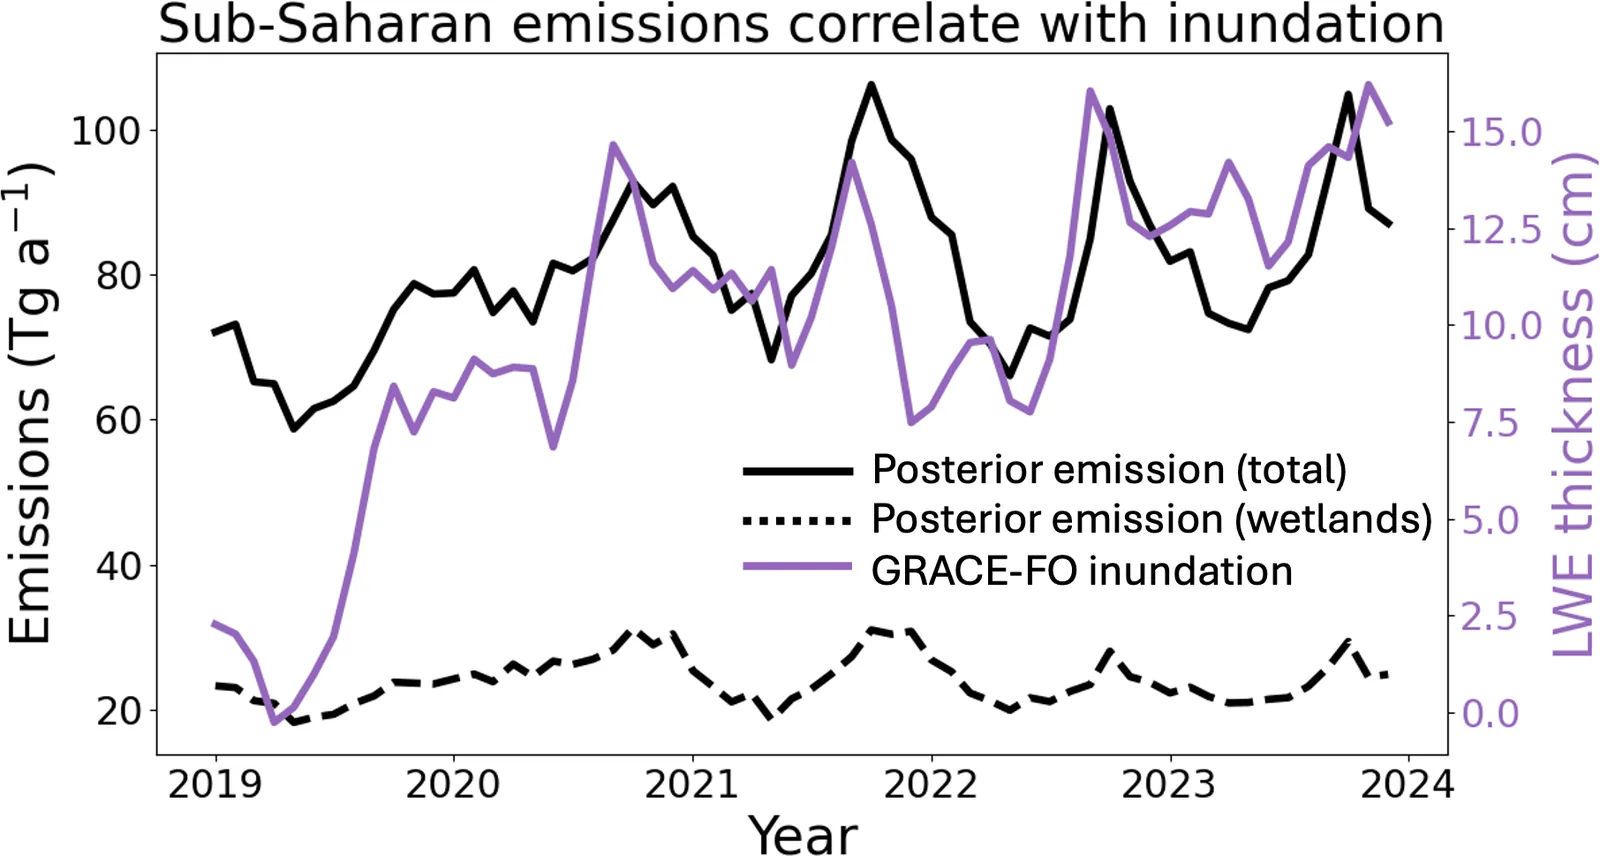
Using TROPOMI satellite data, the authors estimate global methane emissions rose from 560 Tg a−1 in 2019 to 587–592 Tg a−1 in 2020–2021, with sub-Saharan African wetlands, especially in South Sudan, likely playing a major role.
Why it matters
The study suggests that past blame for the 2020–2021 surge on livestock may come from wrong wetland maps in models. It points to tropical wetlands, such as those in South Sudan, as poorly represented and needing better modelling. It also shows a September peak in global emission seasonality, later than wetland models predict.
What they did
The authors fed TROPOMI satellite methane observations into an ensemble Kalman filter inversion (CHEEREIO with the GEOS-Chem model). They estimated monthly emissions at 2° × 2.5° resolution from May 2018 through December 2023. They ran the inversion with two different wetland inventories as starting estimates. They compared the results with NOAA surface sites and GRACE-FO water storage data.
Key findings
- Global emissions rose from 560 Tg a−1 in 2019 to 587–592 Tg a−1 in 2020–2021, then fell to 572–570 Tg a−1 in 2022–2023.
- Sub-Saharan Africa contributed a 14 Tg a−1 increase to the 2020 surge, and the higher level persisted in later years.
- Emission increases in the region track GRACE-FO inundation, which suggests South Sudan wetlands drove much of the surge but are poorly captured by wetland models.
- Boreal emissions declined over 2020–2023, in line with drying seen by GRACE-FO.
- Global emission seasonality is driven by northern tropical wetlands and peaks in September, not July. US oil and gas fields show higher emissions in the cold season.
Limitations
- Changes in the main methane sink, hydroxyl (OH), were not modelled. A drop in OH in 2020 would imply a smaller emissions surge.
- Separating livestock from wetland emissions in eastern Africa is highly uncertain because they overlap and local observations are lacking.
- Missing TROPOMI data in mid-2022 and 2023 required a seasonal correction based on 2021.
Glossary
- Tg a−1: Teragrams per year; one teragram is one million metric tons.
- LETKF: Localized ensemble transform Kalman filter, a method that adjusts model emissions to match observations using many model runs.
- GRACE-FO: A pair of satellites that measure changes in water storage, used here as a sign of wetland flooding.
- OH: The hydroxyl radical, the main chemical that removes methane from the atmosphere.
Original paper
Trends and seasonality of 2019–2023 global methane emissions inferred from a localized ensemble transform Kalman filter (CHEEREIO v1.3.1) applied to TROPOMI satellite observations
Atmospheric Chemistry and Physics · 3 November 2025
AI-generated summary of the original article; changes were made. Check the original before relying on it.