Water use efficiency first rises, then falls, as drought deepens over 57.5% of vegetated land
Ecosystem water use efficiency rises under mild drought but reverses once drought passes a threshold, so earlier reports of both rises and falls may describe two stages of one response.
Why it matters
A rising water use efficiency during drought is often read as resilience. This preprint’s results suggest it may be only temporary, with carbon loss starting once a threshold is crossed. The authors say the threshold could act as an early indicator of where drought begins to erode carbon uptake, and that land models should represent it.
What they did
The authors combined satellite, reanalysis and model-fusion data on carbon uptake (GPP) and evapotranspiration (ET) for 1982–2016. They measured drought with an index built from terrestrial water storage. For each 0.5° grid cell they fitted curves of efficiency against drought severity and sorted cells into two-stage, positive and negative patterns. A Deep Forest model with SHAP then identified the drivers of the patterns and of threshold depth. Finally, they split the efficiency change into GPP and ET parts.
Key findings
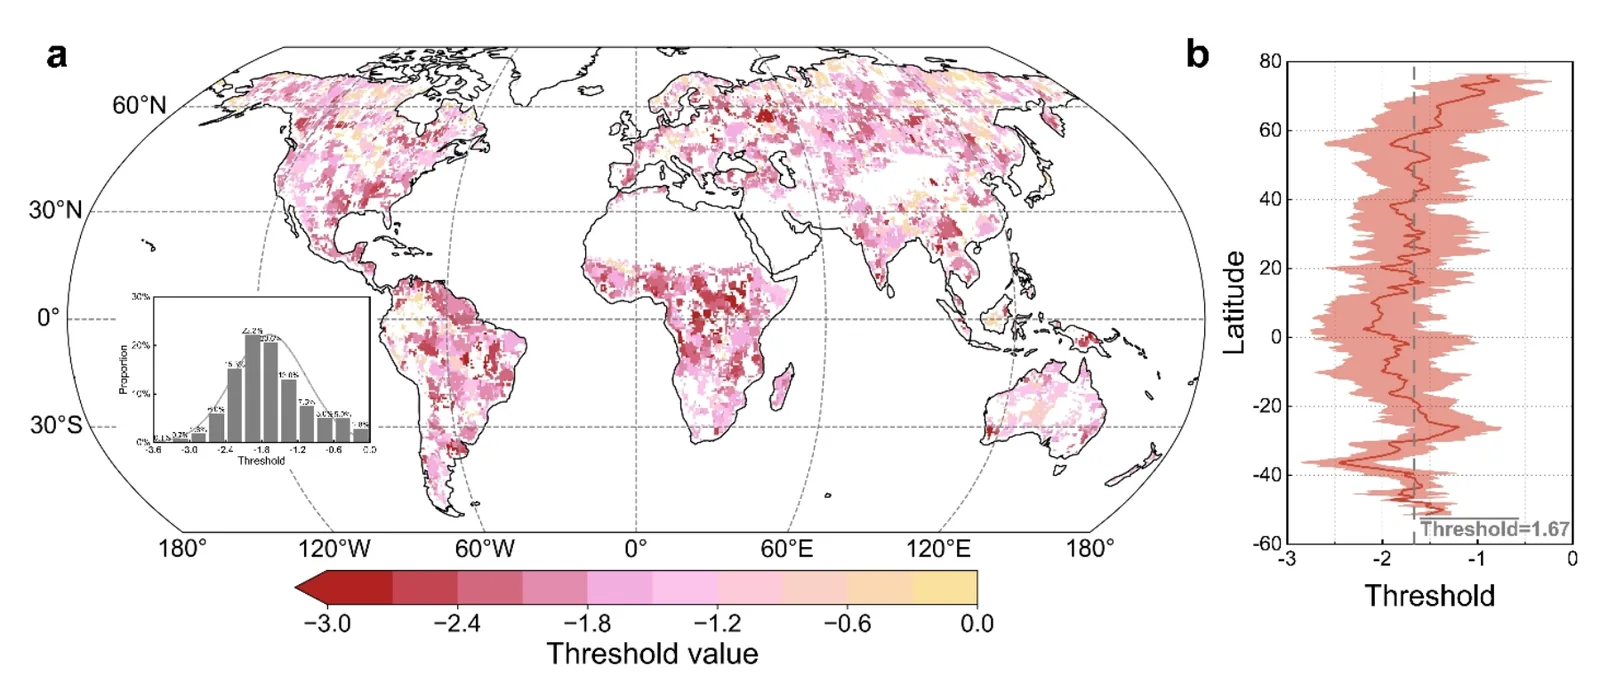
- The two-stage pattern covered 57.5% of vegetated land. The positive pattern covered 27.1% and the negative pattern 11.2%.
- The mean threshold was −1.67 ± 0.61 on the drought index, which the authors call D3-level extreme drought.
- In Stage I, ET fell faster than GPP, which raised efficiency. In Stage II, GPP kept falling while the ET decline levelled off, which pulled efficiency down.
- The Stage II decline was steeper than the Stage I rise, with slope magnitudes of about 0.39 versus 0.07.
- Aridity, net shortwave radiation, leaf area index and vapor pressure deficit were the main controls on threshold depth. Denser canopies had deeper thresholds. Savannas showed the two-stage pattern most often at 66.7%.
Limitations
- The drought index comes from GRACE water storage, which is coarse in space. The authors used smoothing and data fusion to reduce input uncertainty.
- The analysis is at ecosystem scale and cannot resolve species-level hydraulic traits within a grid cell.
- The authors say the thresholds still need validation against eddy-covariance measurements and a longer record.
Glossary
- Water use efficiency (WUE): The ratio of carbon taken up by plants (GPP) to water lost through evapotranspiration (ET).
- TWSA-DSI: A drought severity index based on terrestrial water storage anomalies. Values below 0 mean drought, and lower values mean more severe drought.
- SHAP: A method that shows how much each input variable contributes to a machine-learning prediction.
- Evapotranspiration (ET): Water moving from land to the air by plant transpiration and evaporation.
Original paper
Drought thresholds shape divergent responses in ecosystem water use efficiency
EGUsphere · 14 October 2026
This paper is a preprint. It has not been peer reviewed, and its results may change.
AI-generated summary of the original article; changes were made. Check the original before relying on it.