Droughts cut Upper Colorado streamflow and raised stream temperature and salinity
In four severe droughts from 1998 to 2022, Upper Colorado River Basin streams ran lower, warmer and saltier, and how much they changed depended on catchment traits such as withdrawals, forest cover and baseflow.
Why it matters
Water managers in a heavily used basin need to know which catchments are most exposed to drought. The study links the size of the response to catchment features like freshwater withdrawals and baseflow. It also shows that repeated droughts since 2018 left less time to recover, which matters for planning.
What they did
The authors built a data-driven framework called DIRE. They used the SPEI index to find four drought episodes, then compared streamflow, water temperature and specific conductance (a salinity proxy) with normal years on either side. They used USGS records from 202 flow sites, 36 temperature sites and 23 salinity sites. A deep learning model filled in temperature at 12 extra sites. They then used correlations and an XGBoost model with Shapley values to link responses to GAGES-II catchment attributes.
Key findings
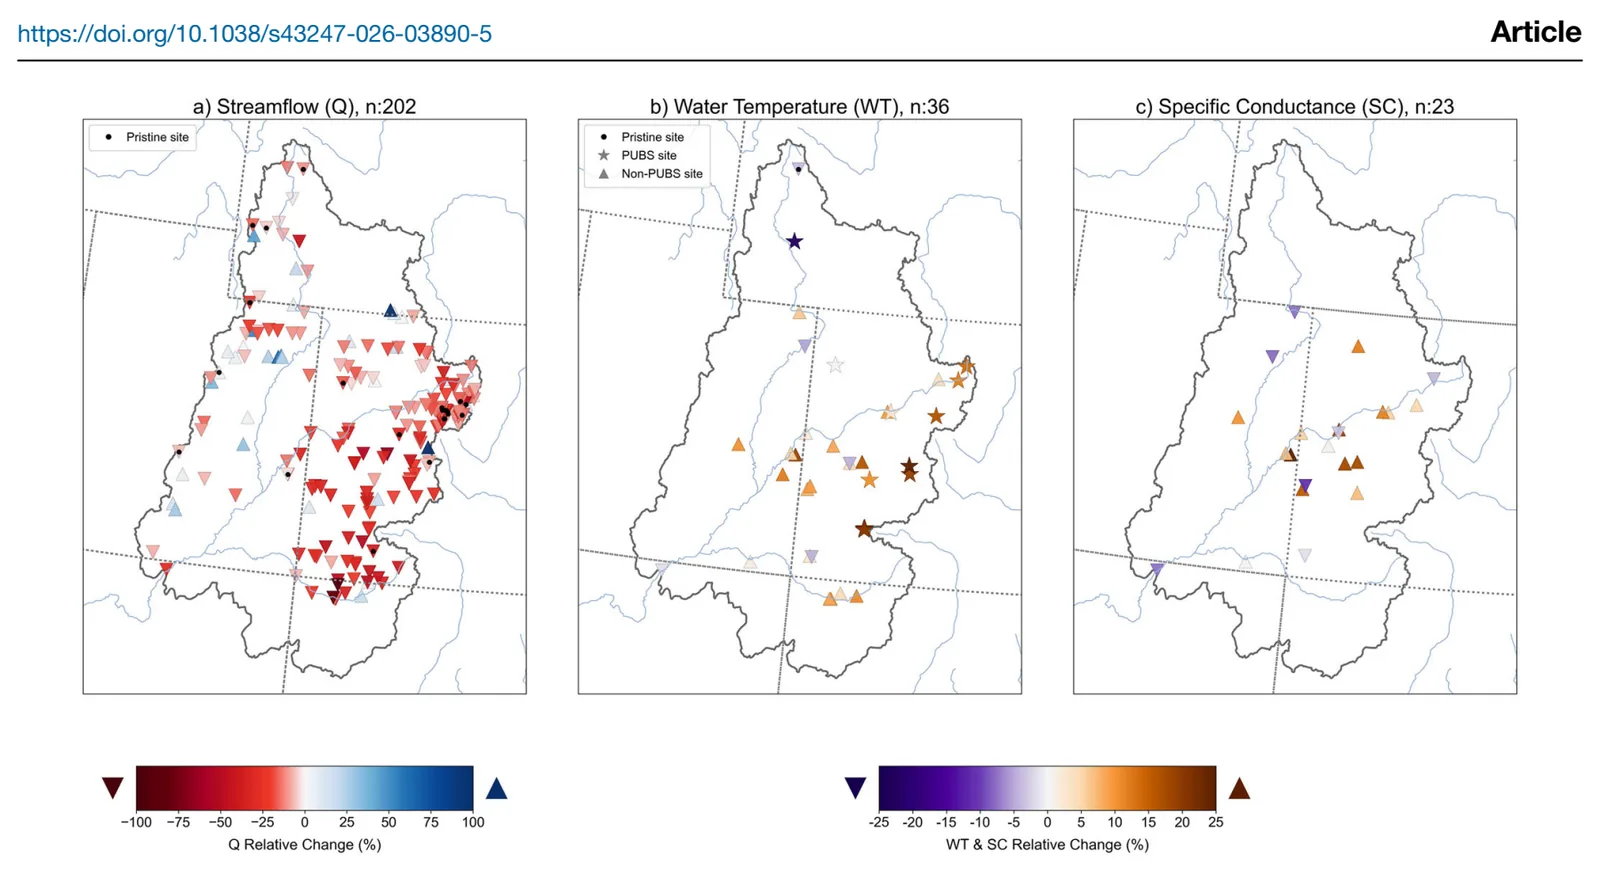
- Annual streamflow fell by about 15% during drought, with 170 of 202 sites showing declines. Peak flows fell most, by 47% basin-wide.
- Water temperature rose by about 9% and salinity by 5%. The biggest changes came in spring and summer.
- Streamflow and salinity recovered after droughts through 2018, with a median streamflow recovery of 3 years. After 2018, 117 sites had not returned to pre-drought flow by 2022. Temperature mostly recovered within 1 to 2 years.
- Larger flow declines went with higher freshwater withdrawals, deciduous forest, finer soils, longer subsurface residence times and higher air temperature. Higher baseflow index and soil permeability went with resilience.
- Open water and reservoirs went with smaller salinity increases. Higher elevation, slope and precipitation went with larger temperature increases.
Limitations
- Temperature and salinity data were sparse, almost an order of magnitude fewer sites than streamflow. Coverage was uneven, and the XGBoost model could not be run for them.
- The streamflow XGBoost model likely overfit, with a test R2 of 0.42 against a training R2 of 0.96. Catchment attributes come only from GAGES-II and omit factors such as management decisions.
- The deep learning temperature model has uncertainties of up to 2 °C, especially at sites affected by groundwater and reservoirs.
Glossary
- SPEI: Standardized Precipitation Evapotranspiration Index, a drought measure that combines rainfall with the water lost to evaporation, which depends on temperature.
- Specific conductance (SC): How well water conducts electricity, used here as a stand-in for salinity.
- Baseflow index: The share of streamflow that comes from groundwater and other slow sources.
- Shapley values: A method that scores how much each input feature contributes to a machine learning model’s predictions.
Original paper
Widespread drought-driven declines in streamflows and water quality in the Upper Colorado River Basin during 1998-2022
Communications Earth & Environment · 14 September 2026
AI-generated summary of the original article; changes were made. Check the original before relying on it.