Waves are projected to shrink in the western North Sea and grow in the east and Baltic
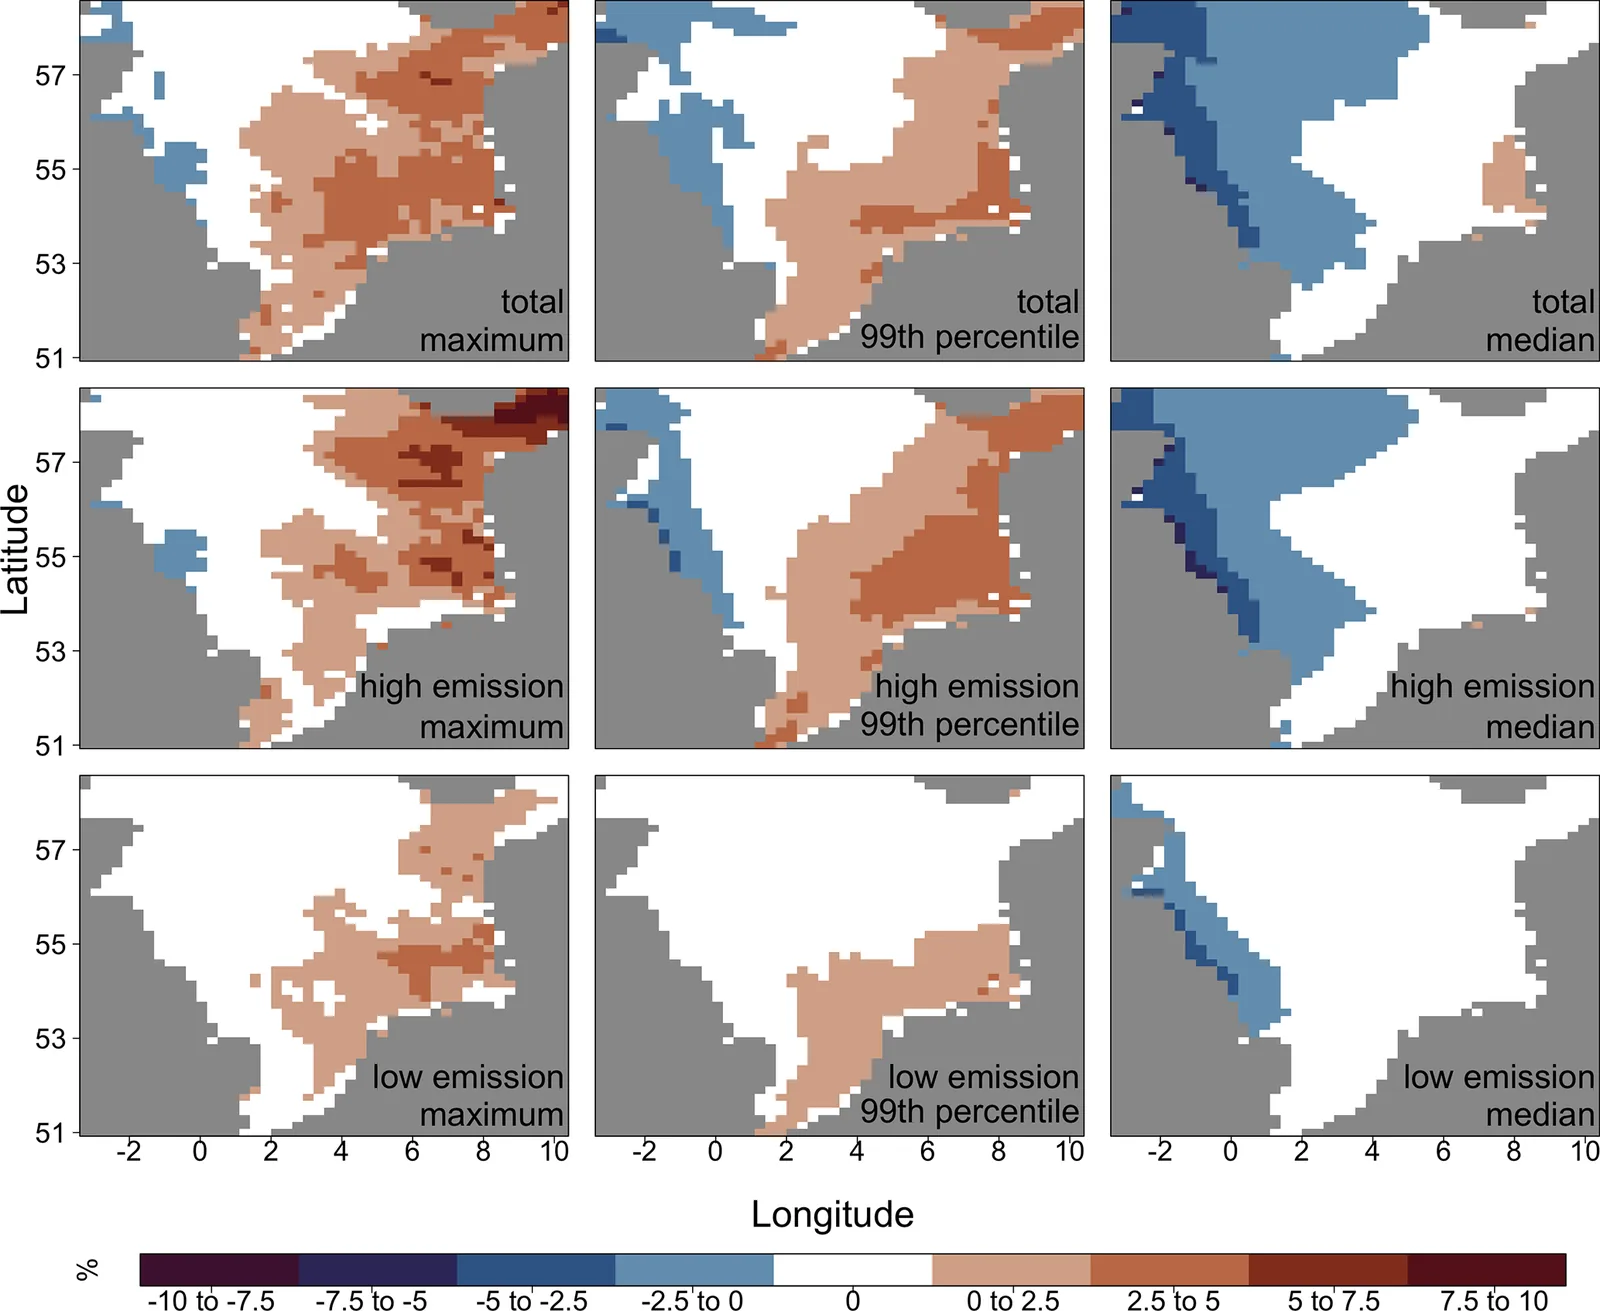
In a wave-model ensemble driven by CMIP3 and CMIP5 climate runs, end-of-century wave heights fall along the western North Sea and rise in the eastern North Sea and much of the Baltic Sea, more so under high emissions.
Why it matters
Coastal protection, shipping, wind farms and offshore platforms depend on wave conditions. The results show where wave heights may change and that high-emission scenarios give stronger changes. They also show that internal variability is large, so single projections are risky to rely on.
What they did
The authors drove the WAM wave model with regional climate projections based on CMIP3 and CMIP5. This gave up to 14 projections for the North Sea and 8 for the Baltic Sea, each with a control run. They split the runs into high-emission and low-emission groups by CO2 level in 2100, using 700 ppm as the cut-off. They compared 2071–2100 with 1961–1990 for annual maximum, 99th percentile and median significant wave height. Agreement across members was tested with a binomial test. Changes over time at four locations were tested with a Mann–Whitney U test.
Key findings
- The North Sea shows a west-to-east gradient. Wave heights fall along the British coast and rise in the east and south.
- Under high emissions, median wave height falls by up to 5 % in the west, and annual maxima rise by over 5 % in the east.
- In the Baltic Sea, median and extreme wave heights rise by more than 5 % in some areas. High-emission runs give stronger increases.
- At Tyne, the high-emission median falls significantly from around 2030, reaching about 5 % by the end of the century.
- In the Central Baltic Proper, the high-emission maximum rises by up to 10 % and is significant from mid-century.
Limitations
- Many changes are not statistically significant, and individual members differ widely because of internal variability, from -20 % to +20 %.
- Splitting scenarios into just high and low emission is broad and adds uncertainty. The runs also leave out sea-level rise and bathymetry changes.
- The projections use CMIP3 and CMIP5 forcing. Regional CMIP6 forcing was unavailable and may change the results.
Glossary
- Significant wave height (SWH): A standard measure of sea state, describing typical wave height.
- Ensemble of opportunity: A set of available simulations, all treated as equally plausible and not weighted.
- CMIP3/CMIP5: Coordinated international rounds of global climate model experiments, phases 3 and 5.
- Time-slice experiment: A simulation of only selected periods, not a continuous run.
Original paper
An ensemble of regional CMIP3/CMIP5 wind wave scenarios for the North Sea and the Baltic Sea: a revisit
Ocean Science · 16 October 2026
AI-generated summary of the original article; changes were made. Check the original before relying on it.