European forest carbon sink shrank in 2020-2023 across satellite, inventory and inversion data
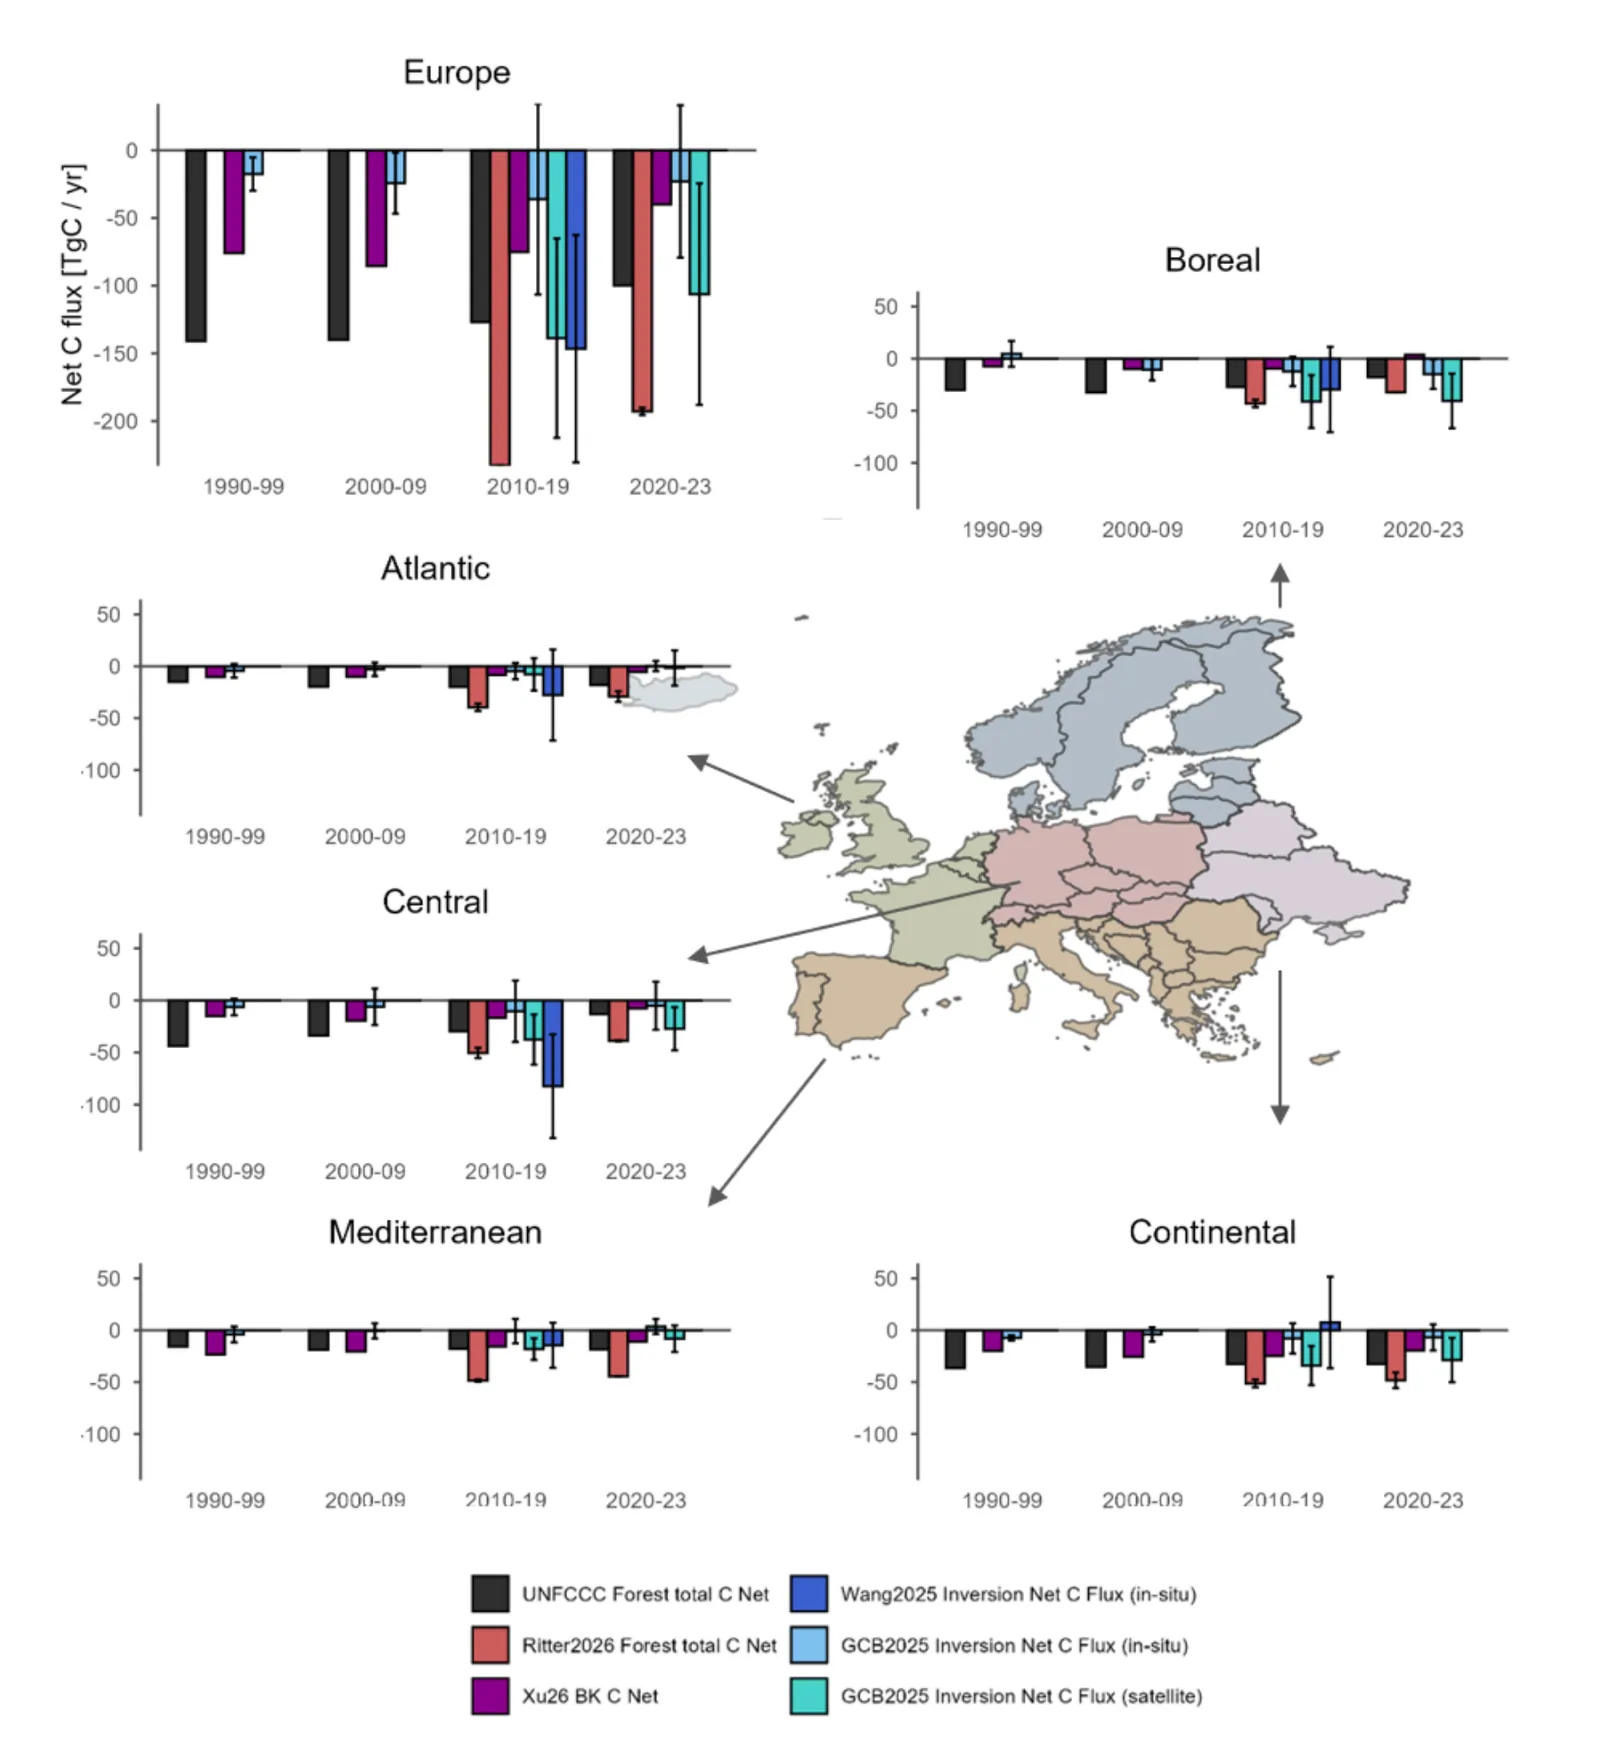
Satellite data, national inventories and atmospheric inversions all show Europe's forest carbon sink weakening, mainly in central and boreal Europe, but they disagree on how large the carbon losses are.
Why it matters
The EU counts on forests as a carbon sink to meet its climate targets. A weaker sink puts those targets at risk. The study shows where the sink is falling and why the data sources differ, which helps combine them for faster, better tracking of forest losses.
What they did
The authors compared national greenhouse gas inventories with several high-resolution satellite products on biomass, disturbance and carbon losses. They also used two satellite-based bookkeeping models and atmospheric CO2 inversions. All data were put in common units and summed by country and region for 1990 to 2023. A case study of wildfire emissions in Italy tested the inventory against satellite biomass.
Key findings
- All datasets agree the forest carbon sink fell by 17-27% in 2020-2023 compared with the 1990-2019 average, leaving a sink of -100 to -193 TgC/yr.
- Central and boreal Europe contribute most to the decline.
- Per the inventories, the net sink has weakened since 2010 at a 15-fold faster rate than it strengthened before 2010.
- Natural disturbance losses grew more than harvest losses: 80% from 2010-19 to 2020-23 (14 to 25 TgC/yr), versus 2% for harvest.
- Country-level carbon losses from satellites and inventories often differ by a factor of 2-3. Inventories mostly report higher losses.
Limitations
- Ten countries, including Germany, do not report gross losses in their inventories and had to be dropped from the loss comparison, so regional losses are not representative of the whole continent.
- Satellite loss maps miss small, sub-canopy disturbances such as thinning, and differences in forest definitions and data coverage limit direct comparison with inventories.
- Inventory numbers for recent years are revised between versions, by up to about 10 TgC/yr, and in-situ and satellite inversions differ a lot in magnitude.
Glossary
- NGHGI: National greenhouse gas inventory, the yearly report each country sends to the UNFCCC.
- Atmospheric inversion: A top-down method that infers carbon sources and sinks from measured CO2 in the air.
- Bookkeeping model: A model that tracks carbon gains from regrowth and losses from disturbance over time.
- AGC: Aboveground carbon, the carbon stored in the living parts of trees above the soil.
Original paper
EU forest carbon sink decline as seen by Earth observation and national inventories
EGUsphere · 22 October 2026
This paper is a preprint. It has not been peer reviewed, and its results may change.
AI-generated summary of the original article; changes were made. Check the original before relying on it.