Satellite estimates of city methane emissions exceed inventories in London, Los Angeles and New York
An improved mass-balance method using TROPOMI satellite data and boundary-layer winds finds city methane emissions well above bottom-up inventories, with large uncertainties.
Why it matters
City methane inventories are hard to check. This method gives a fairly simple, repeatable way to test them from space, and it could be applied to cities worldwide. The results suggest inventories miss sources, but sparse cloud-free data limits how firm the estimates are.
What they did
The authors used TROPOMI methane column data for 2021–2023, regridded to 0.1°×0.1° for each satellite pass. They improved the source pixel method in two ways. They used pressure-weighted wind through the boundary layer from ERA5, not 10 m wind. They also took the background from an equal-area region directly upwind. They computed an emission rate for each pass, propagated errors from methane enhancement and wind, and compared the results with EDGAR, NAEI and EPA inventories and earlier top-down studies.
Key findings
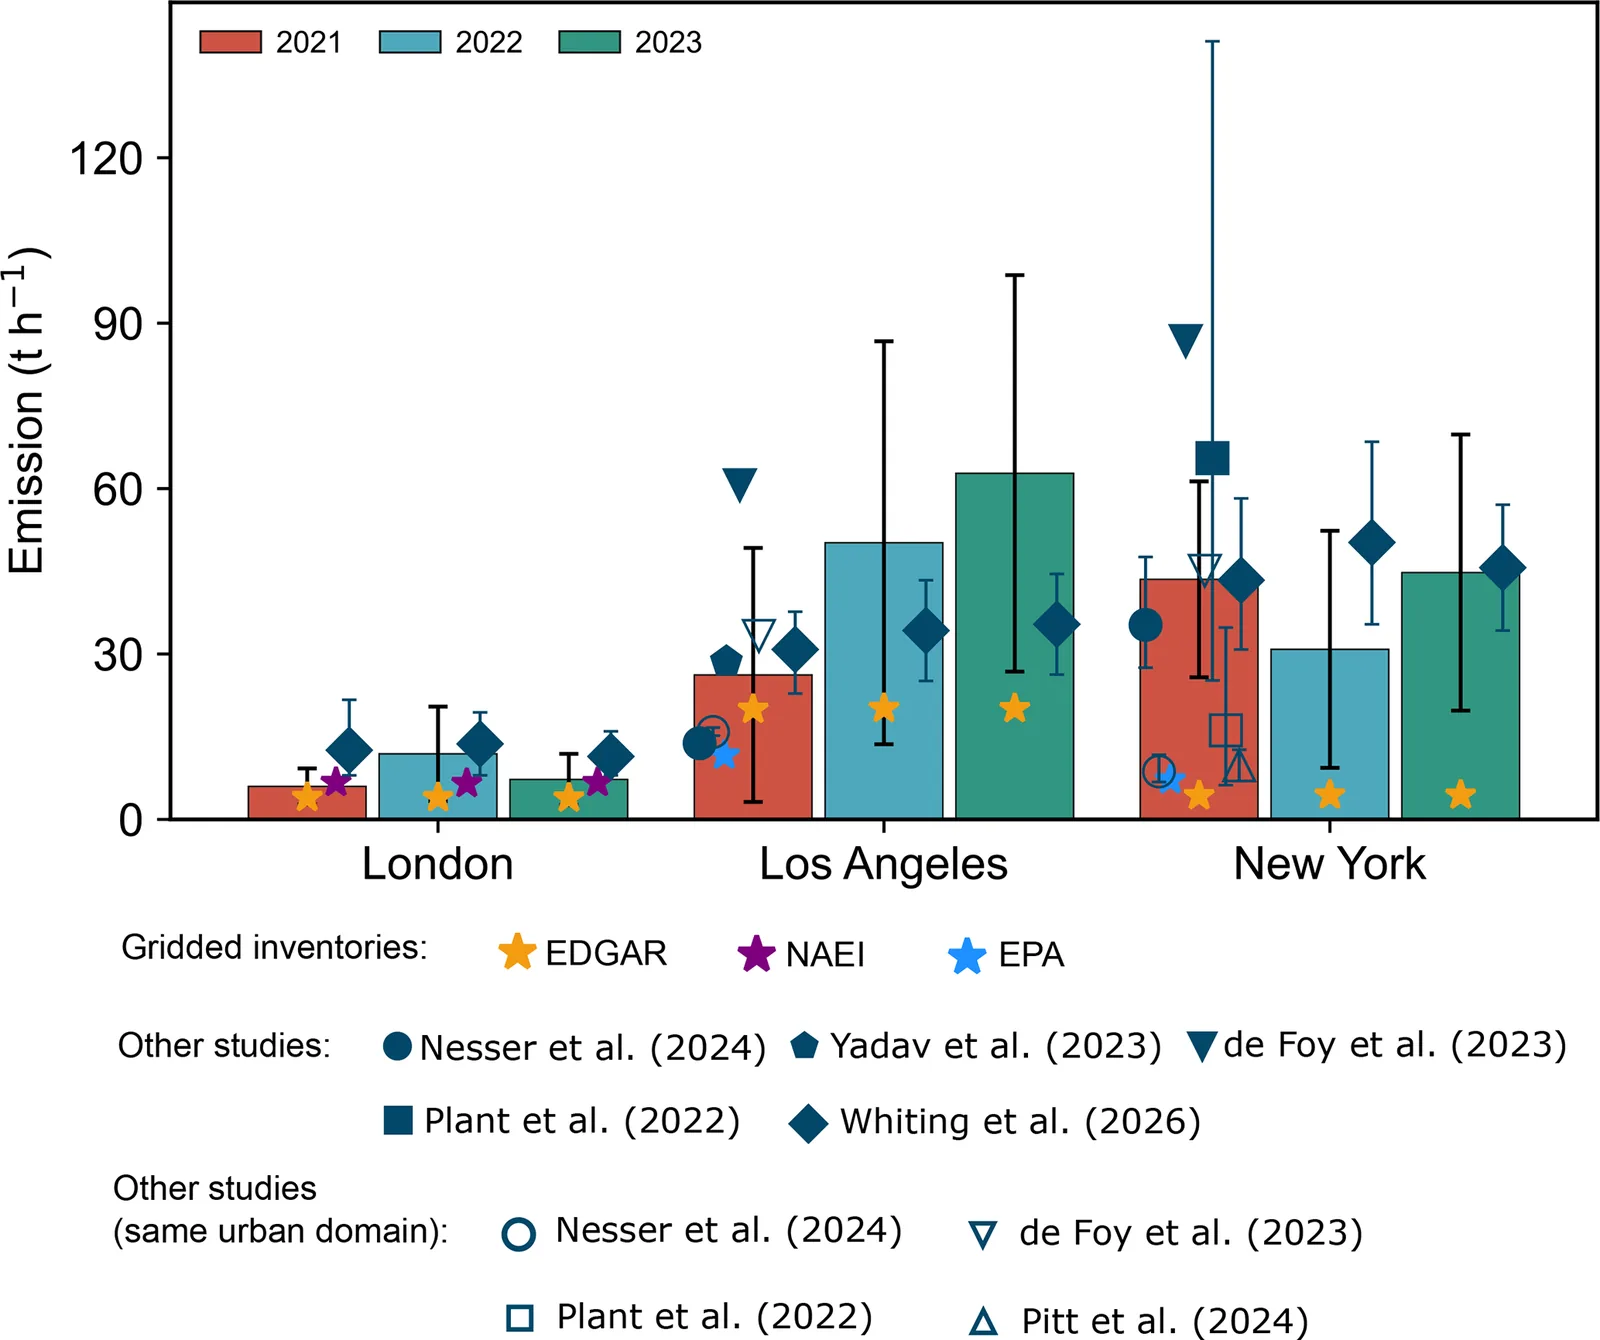
- Annual satellite-derived emissions for 2021 to 2023 range from 5.99 to 11.90 t h−1 in London, 26.21 to 62.77 t h−1 in Los Angeles, and 30.85 to 44.77 t h−1 in New York.
- These are about 1.5–3.0, 1.3–3.1 and 7.0–10.2 times the inventory estimates for London, Los Angeles and New York.
- Most earlier top-down estimates fall within the uncertainty bounds, after rescaling to the same urban area. One study’s estimates are relatively high and fall outside them.
- Boundary-layer winds differ clearly from 10 m winds and are higher, which raises the computed emission rate.
- London’s uncertainty comes mostly from the methane enhancement (about 80 %), while in Los Angeles more than half comes from wind.
Limitations
- Strict quality filters remove most overpasses, because of cloud, coasts and water. This leaves few valid scenes, for example only 5 in New York in 2021, and may bias seasonal and yearly results.
- Estimates are sensitive to the background, especially in weakly enhanced London. One low month in 2021 changes that year’s value strongly.
- Uncertainties are large and comparisons with other studies are hard because city boundaries and reporting periods differ. Rescaling to a common area adds further uncertainty.
Glossary
- TROPOMI: A satellite instrument that measures the methane column in the air using reflected sunlight.
- Source pixel method: A mass-balance approach that infers emissions from the methane enhancement over a source area and the mean wind.
- Planetary boundary layer (PBL): The lowest part of the atmosphere, where surface emissions are mixed and carried by wind.
- XCH4: The column-averaged dry-air mole fraction of methane.
Original paper
Satellite-based global monitoring of urban-scale methane emissions
Atmospheric Measurement Techniques · 29 September 2026
AI-generated summary of the original article; changes were made. Check the original before relying on it.