Empirical quantile mapping is the most balanced way to correct GCM rainfall on six continents
When bias correction of climate model rain is judged on both accuracy and uncertainty, empirical quantile mapping wins most often, while detrended quantile mapping wins least.
Why it matters
Choosing a bias correction method changes both how accurate and how uncertain corrected rainfall is. The paper’s index lets users weigh these two aims and see where the best choice flips. Picking a method on error metrics alone could miss these shifts.
What they did
The authors corrected daily rainfall from 11 CMIP6 climate models over 1980–2014 using three quantile mapping methods: QDM, EQM and DQM. They trained on 1980–1996 and tested on 1997–2014 against ERA5 data on a 1° grid. They scored each method with ten metrics and ranked them with TOPSIS. They measured uncertainty with Bayesian Model Averaging, then combined both into a Comprehensive Index (CI) under three weightings of performance versus uncertainty.
Key findings
- All three methods beat the raw model rainfall in Taylor diagrams. EQM was closest to the reference data and DQM was furthest.
- EQM scored best on most metrics (RMSE 0.30, MAE 0.18, R2 0.98, KGE 0.87, NSE 0.93, EVS 0.99). It also had the lowest uncertainty (variance 0.0027) across all continents.
- TOPSIS picked EQM in most grid cells on every continent, and DQM was chosen least. In South America QDM had the lowest model uncertainty (variance 0.0025).
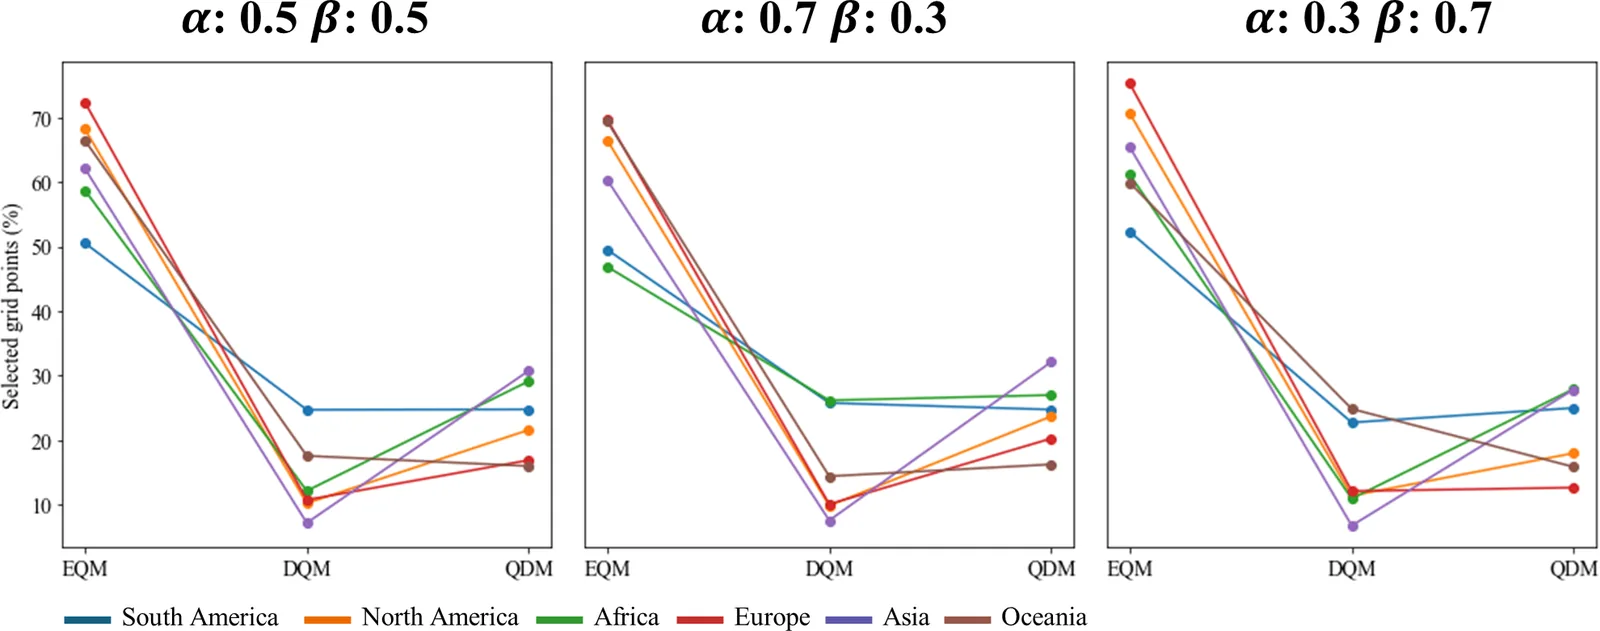
- In the CI, EQM was chosen most often under all three weightings. Giving uncertainty more weight raised the number of EQM grids.
- In South America DQM was picked more than QDM when performance was stressed, but QDM was picked more when uncertainty was stressed. Oceania showed the reverse.
Limitations
- Only three quantile mapping methods were tested, because a global run was computationally costly. Adding more methods would make the results stronger.
- The study covers only the historical period and does not use greenhouse gas scenarios, which the authors list as future work.
- The CI results depend on the weights the user picks for performance and uncertainty.
Glossary
- Quantile mapping: A bias correction that adjusts model values so their distribution matches the observed distribution.
- TOPSIS: A ranking method that scores options by how close they are to an ideal best and far from an ideal worst across several criteria.
- Bayesian Model Averaging (BMA): A way to combine several models with weights, which also measures how much the models disagree.
- Comprehensive Index (CI): The authors’ score that combines the TOPSIS performance score with the BMA uncertainty measures.
Original paper
Intercomparison of bias correction methods for precipitation of multiple GCMs across six continents
Geoscientific Model Development · 30 October 2025
AI-generated summary of the original article; changes were made. Check the original before relying on it.