ICON model matches Arctic warm and cold airmass changes well, with errors near the surface
Aircraft that re-sampled the same air parcels showed the ICON model reproduces temperature and humidity changes in Arctic warm air intrusions and cold air outbreaks fairly well, with the biggest misses close to the surface.
Why it matters
Weather models struggle with the lowest layer of the Arctic atmosphere, and few observations exist to test them. This study offers a way to check how well a model follows an airmass as it moves, not just at fixed points. It also shows which processes drive the heating and cooling, which helps target model improvements.
What they did
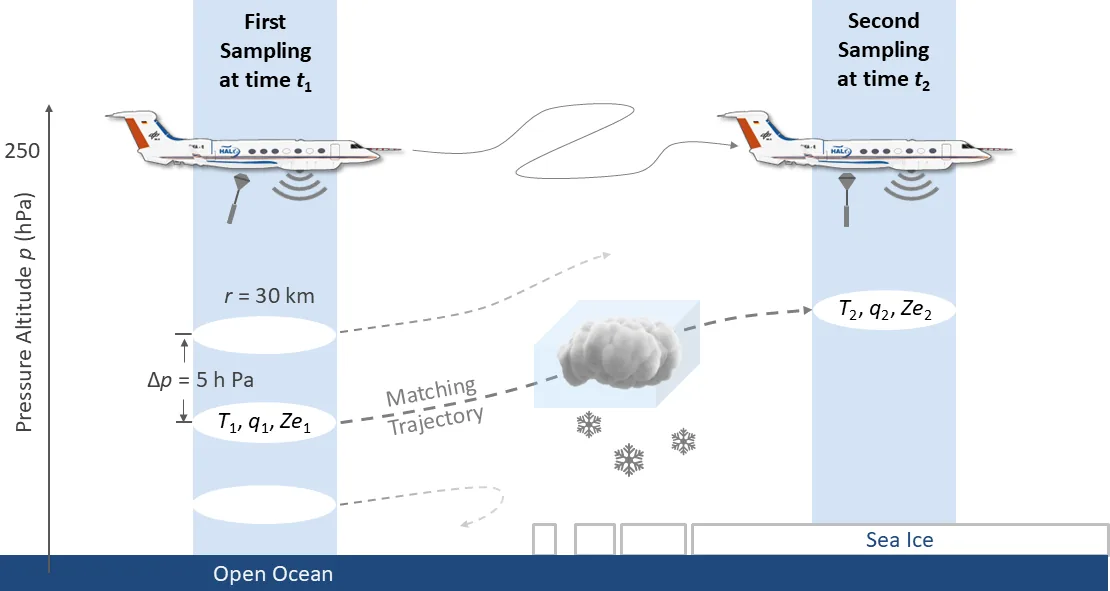
The authors used dropsonde and cloud radar data from 12 HALO research flights in March and April 2022: six warm air intrusions and six cold air outbreaks. They compared these with ICON runs at 2.4 km resolution, first at fixed places and times. Flights were planned from forecast trajectories so the same air parcels were seen twice. Afterwards the authors recalculated trajectories with ICON winds. They used these to compare observed and modeled change rates and to split modeled heating into adiabatic and diabatic parts.
Key findings
- Modeled temperature profiles agreed well with dropsondes, but ICON had a cold bias of up to -0.9 K, largest in cold air outbreaks.
- Specific humidity was reproduced with mean deviations of 6.0 % for warm air intrusions and 19.5 % for cold air outbreaks.
- ICON did not capture the height of the near-surface temperature inversion well, mostly in cold air outbreaks over sea ice.
- Adiabatic processes dominated heating and cooling of air parcels. Among diabatic processes, latent heating and turbulence mattered more than terrestrial radiation.
- In the cold air outbreak case, the observed warming of up to 5 K h−1 and the moistening were well reproduced. For warm air intrusions, the cooling and drying were not perfectly captured, especially near the surface.
Limitations
- Between 2 % and 9 % of trajectories in warm air intrusions hit the measurement volume a second time, and 10 % to 35 % in cold air outbreaks, which limits the matched samples.
- The study covers only 12 flights, with two cases analysed in detail, and only marine cold air outbreaks.
- ICON’s one-moment cloud scheme gives a narrower radar reflectivity range than observed, and the dropsonde drift was ignored in the comparison.
Glossary
- Warm air intrusion: A poleward flow of warm, moist air from mid-latitudes into the Arctic.
- Cold air outbreak: A flow of cold, dry air from the Arctic sea ice out over warmer open ocean.
- Quasi-Lagrangian sampling: Flying so the aircraft observes the same moving air parcel at least twice.
- Dropsonde: A small sensor package dropped from an aircraft that measures temperature, humidity and wind on the way down.
Original paper
Observed and modeled Arctic airmass transformations during warm air intrusions and cold air outbreaks
Atmospheric Chemistry and Physics · 7 November 2025
AI-generated summary of the original article; changes were made. Check the original before relying on it.