Radar backscatter from Sentinel-1 tracks sea ice freeboard and helps upscale altimetry
In two April 2019 case studies, C-band radar backscatter correlated with sea ice freeboard, and this link let the authors predict the spread of freeboard values away from altimeter tracks.
Why it matters
Laser altimeters like ICESat-2 only see a narrow strip of ice. Radar images cover far more area. Using them to fill in freeboard could give a fuller picture of Arctic sea ice. The link varies from place to place, so any such upscaling has to be done locally.
What they did
The authors matched Operation IceBridge airborne laser freeboard maps with Sentinel-1 radar images from 8 and 12 April 2019. They split the flight tracks into 9 km segments and shifted the maps to line them up. They fitted straight-line relations between backscatter and freeboard at several scales. They also fitted mixtures of log-logistic distributions to freeboard within each backscatter bin. They then used the fits from the inbound flight to predict freeboard on the outbound flight, and repeated the test with ICESat-2 footprints.
Key findings
- Backscatter and freeboard were significantly correlated at all scales tested. For one sample segment, Pearson’s r rose from 0.61 at 40 m to 0.81 at 200 m.
- The fitted relation varied a lot. For multiyear ice, the slope on 12 April was about 50 % shallower than on 8 April.
- Fits over 27 km segments were more stable than over 9 km segments. The variance of the slope fell by 48.6 % on 8 April and 76.8 % on 12 April.
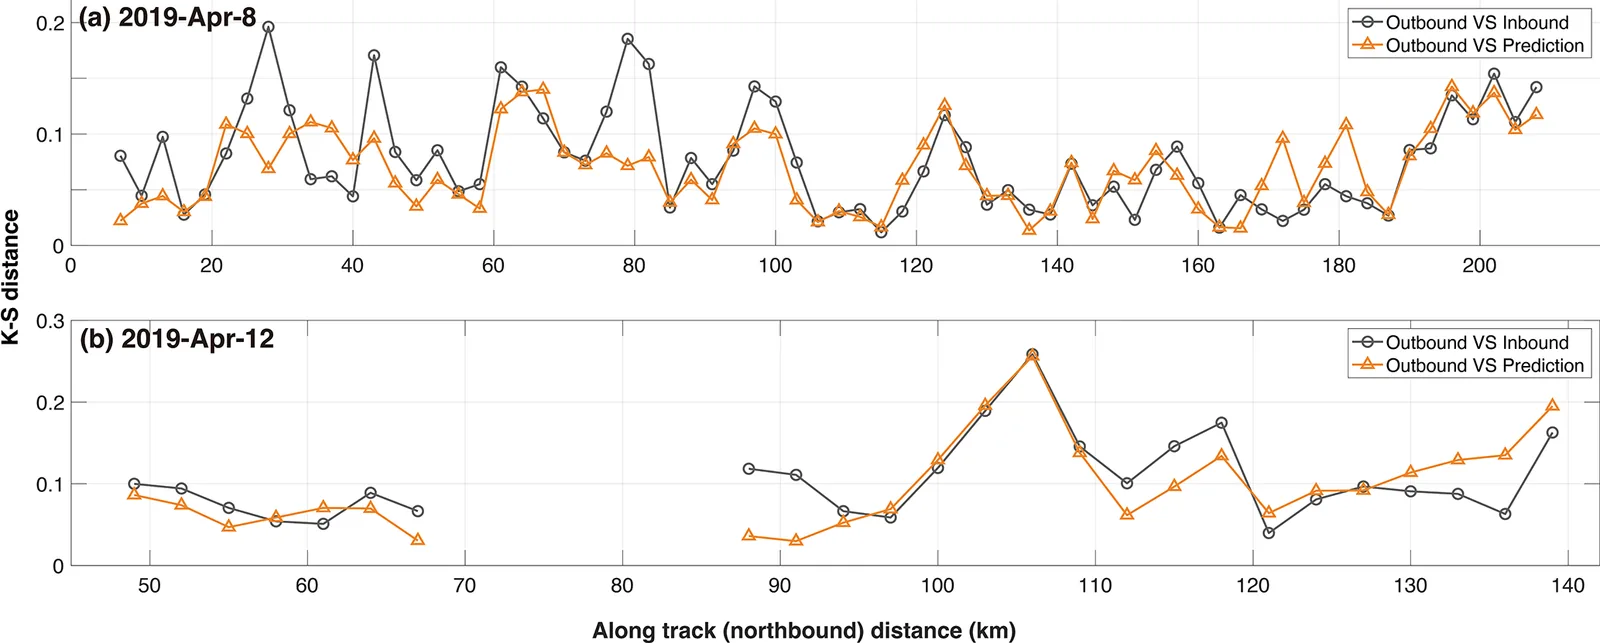
- The predicted meter-scale freeboard distribution matched the outbound observations better than simply using the inbound distribution. The mean K-S distance was 0.077, a 10 % reduction.
- With ICESat-2 footprints, the K-S distance fell from 0.189 to 0.123 on 8 April and from 0.182 to 0.119 on 12 April, mainly because thin ice was better represented.
Limitations
- This is a case study of two flights in spring 2019. It covers mostly multiyear ice, and thin and first-year ice are sampled unevenly.
- The relationship is local and changes over time. Correlations dropped when radar images were taken a week away from the flights, especially when the ice had deformed.
- Radar incidence angle was not corrected for, and the results depend on the accuracy of the ice type maps and the collocation. The data come from dry late-winter snow, so other seasons would need snow conditions taken into account.
Glossary
- Freeboard: The height of the ice (with snow) surface above the local sea level.
- Backscatter (σ0): The share of radar energy that a surface reflects back to the satellite.
- K-S distance: A score from 0 to 1 for how far apart two distributions are. Lower means a closer match.
- Operation IceBridge (OIB): NASA airborne campaigns that measure polar ice height with a laser scanner.
Original paper
On the statistical relationship between sea ice freeboard and C-band microwave backscatter – a case study with Sentinel-1 and Operation IceBridge
The Cryosphere · 29 October 2025
AI-generated summary of the original article; changes were made. Check the original before relying on it.