Temperature forecasts are much less accurate in low-income countries than in rich ones
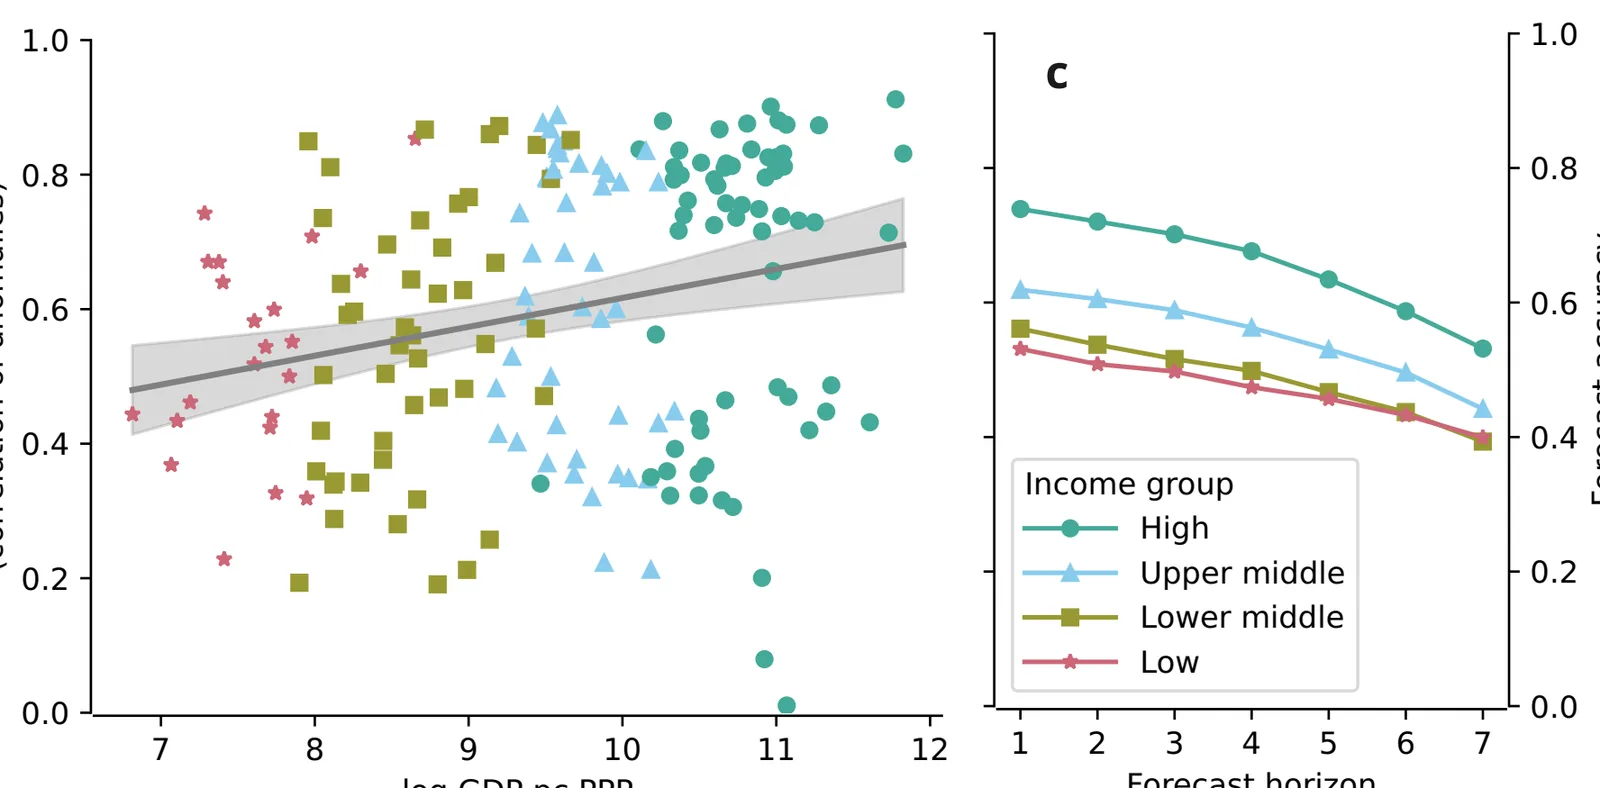
A seven-day temperature forecast in a high-income country is about as accurate as a one-day forecast in a low-income country, and the gap has barely closed in 20 years.
Why it matters
Forecasts help people prepare for heat and other weather shocks, so uneven accuracy can deepen existing economic inequality. Part of the gap comes from the tropics being hard to predict. Another part comes from sparse and infrequently reporting weather stations and radiosondes, which can be improved.
What they did
The authors checked daily ECMWF forecasts from 1985 to 2020 against NOAA land-station observations. They scored accuracy as the correlation between forecast and observed temperature anomalies, averaged by country with population weights, and linked it to GDP per capita. They also mapped stations, radiosondes and drifting buoys. They used a gradient-boosted tree model (XGBoost) with Shapley values to split the variation in accuracy between geography and observation density.
Key findings
- Countries with higher income have more accurate temperature forecasts at every horizon from 1 to 7 days, and the pattern also holds for precipitation and surface pressure.
- Forecasts improved for all income groups since 1985, but the gap between low- and high-income countries was 0.14 in 1991-2000 and is still around 0.10 in 2011-2020.
- Forecast accuracy in low-income countries in 2011-2020 matched that in high-income countries about 17 years earlier.
- Geography explains 59.7% of the variation in accuracy between countries. Station density explains 4.4% and radiosonde density 3.0%, and observation density matters more in the tropics.
- High-income countries have more stations and radiosondes and report more often. About 76% of high-income countries but only about 19% of low-income countries report an official capital forecast to the WMO.
Limitations
- Seasonal forecasts of monthly temperature show the opposite pattern, with some tropical countries doing best.
- The observation data only include stations and radiosondes whose countries share their data, so inequality in infrastructure may be over- or underestimated.
- The results are associations, not proof of cause. Much of the gap reflects the tropics being inherently hard to predict, and satellite data were not analysed.
Glossary
- Anomaly correlation: A score of how well a forecast tracks departures from the usual temperature for that place and date; 1 is perfect.
- Radiosonde: A balloon-borne instrument that measures the atmosphere as it rises.
- Shapley value: A way to split a model’s explained variation among its input variables.
- Extratropics: The regions outside the tropics, at higher latitudes.
Original paper
Global inequalities in weather forecasts
Nature Communications · 14 September 2026
AI-generated summary of the original article; changes were made. Check the original before relying on it.