Adding a deep-learning extreme weather factor improves WOFOST wheat simulations
Feeding extreme weather indices through an LSTM into the wheat development rate of WOFOST cut errors in heading, maturity and yield on the North China Plain, including in extreme years.
Why it matters
Standard crop models often handle extreme weather poorly and underestimate yield losses. A hybrid that keeps the process-based structure while learning extreme-weather effects may help planners judge yields as extremes grow more common. It needs the full season’s weather, so it cannot yet be used for in-season forecasts.
What they did
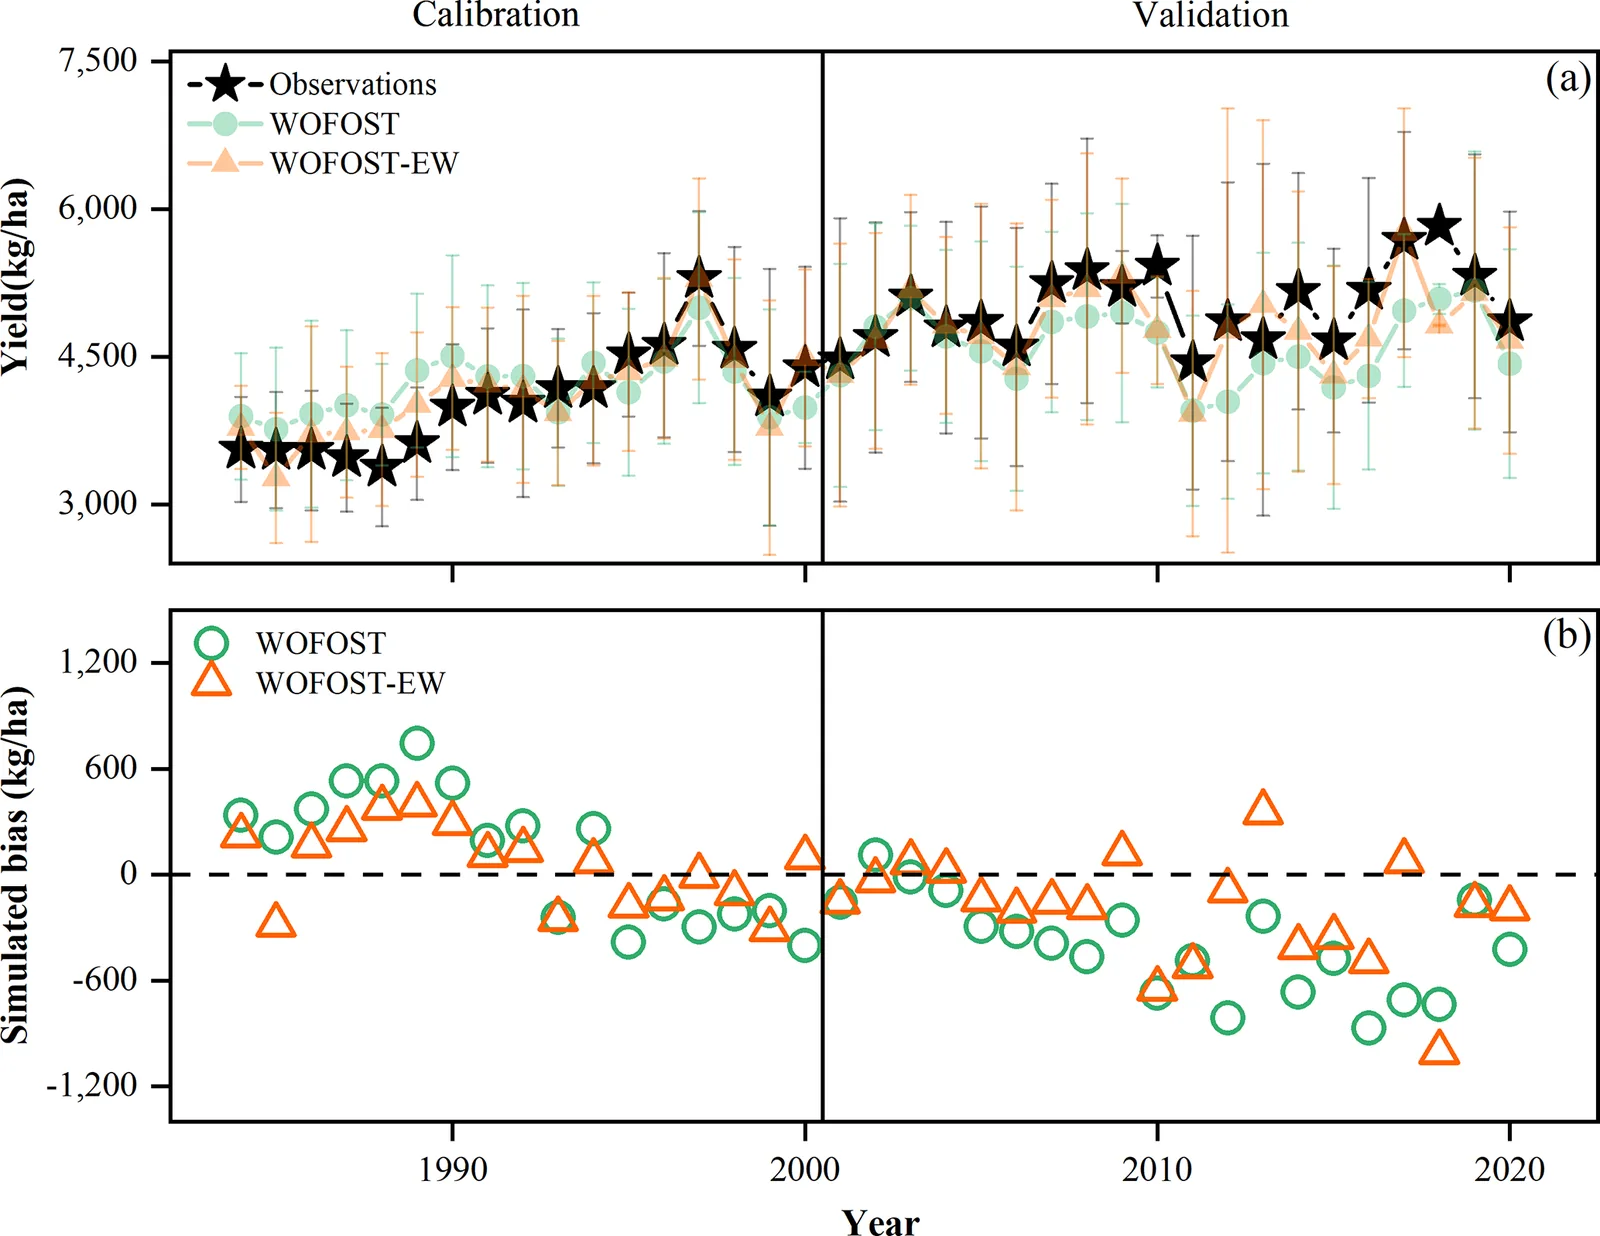
The authors built WOFOST-EW v1. They trained an LSTM network on seven extreme weather indices to produce a correction factor, F(EW). This factor multiplies the development rate in the WOFOST crop model. They calibrated on 1980–2000 data from 25 counties and tested on independent data from 2001–2020. They also tested separately on four extreme-weather years: 2009, 2010, 2012 and 2018.
Key findings
- RRMSE for heading fell from 4.61 % to 3.73 % and for maturity from 4.74 % to 3.98 %, with RMSE reductions of 10.64 % and 12.86 %.
- Yield R2 in the validation period rose from 0.67 to 0.76.
- Yield MAE in the validation period fell from 566.08 kg ha−1 to 463.82 kg ha−1.
- In the four extreme-weather years, R2 was 0.80 to 0.86 for WOFOST-EW, against 0.61 to 0.71 for WOFOST.
- The factor 1 - F(EW) was higher in years with extreme climate and stable in normal years.
Limitations
- F(EW) needs the whole growing-season weather, so the model cannot be used for in-season forecasts.
- Only heading and maturity were modelled, and F(EW) is one season-wide value, so the model underperformed in several counties.
- The model assumes no nutrient limitation and leaves out pests, disease and other non-weather factors. Other crops and regions would need recalibration.
Glossary
- WOFOST: A process-based crop growth model that simulates daily biomass build-up and yield.
- LSTM: Long Short-Term Memory, a type of recurrent neural network that learns patterns in sequences.
- HDD and LDD: High- and low-temperature degree days, which add up how much temperature goes past heat or cold thresholds for wheat.
- PDSI: Palmer Drought Severity Index, a measure of drought that balances water supply and demand.
Original paper
Modeling wheat development under extreme weather with WOFOST-EW v1
Geoscientific Model Development · 10 November 2025
AI-generated summary of the original article; changes were made. Check the original before relying on it.