Emissions drove China's ozone rise to 2017; weather and warming now dominate
A random forest method that holds emissions fixed finds that emissions drove China's summer ozone up and then down, while heatwaves, rain and long-term warming now shape recent changes.
Why it matters
Clean air policy needs to know how much of an ozone change comes from emissions and how much from weather. The authors find that emission cuts gave smaller gains after 2020, and that warming pushes ozone up. They argue that ozone control should be paired with climate adaptation and region-specific emission strategies.
What they did
The authors built random forest models for each city and each year from 2015 to 2023, using hourly ozone data and ERA5 weather data. In their fixed emission approximation, a model trained on one baseline year is run with another year’s weather. This separates the weather effect from the emission effect. They also used SHAP values to study the 2022 heatwave and prolonged rainfall. Satellite formaldehyde-to-NO2 ratios were used to diagnose ozone chemistry. Finally, they ran the models on weather data from 1970 to 2023 with emissions held fixed.
Key findings
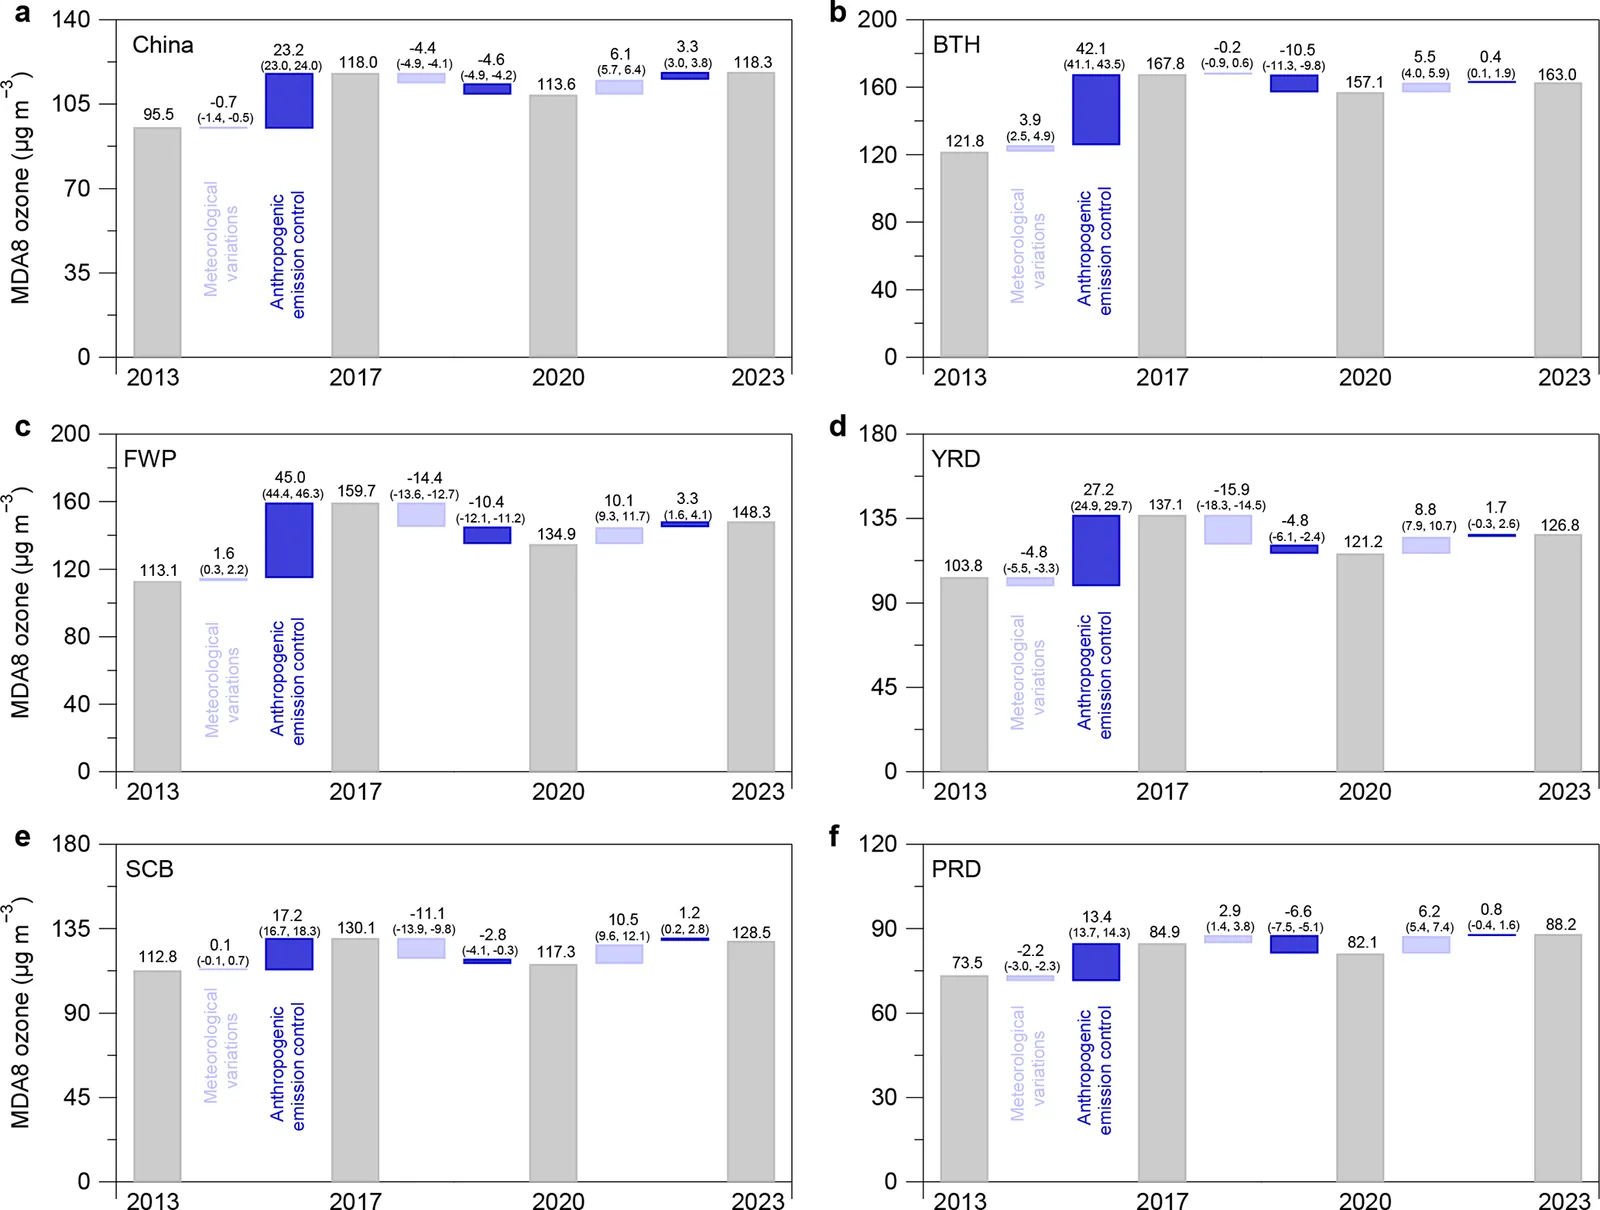
- Emissions drove a national rise of about +23.2 ± 1.1 µg m−3 in summer MDA8 ozone during 2013–2017, then a fall of about -4.6 ± 1.5 µg m−3 during 2017–2020.
- Weather explained 58 ± 12 % (FWP), 77 ± 18 % (YRD) and 80 ± 17 % (SCB) of the 2017–2020 ozone decline in those regions.
- The 2022 heatwave raised ozone by +20.8 ± 3.6 µg m−3 in the YRD and +22.1 ± 3.2 µg m−3 in the SCB. Heavy rain in 2023 cut ozone by -17.8 ± 2.3 µg m−3 in the YRD.
- Satellite ratios showed VOC-limited areas shrinking from 2018 to 2023. In the YRD they fell from about 35 % to about 22 %.
- With emissions fixed, climate change raised urban summer ozone by about 0.06 µg m−3 yr−1 nationwide since 1970. The rise was 0.12 µg m−3 yr−1 in BTH and SCB.
Limitations
- The model does not explicitly resolve grid-scale spatial variation, vegetation feedbacks or land-use change.
- The long-term climate analysis assumes emissions are not themselves affected by climate change.
- Sensitivity to spatial resolution needs further study, for example by combining machine learning with chemical transport models.
Glossary
- MDA8 ozone: Maximum daily 8-hour average ozone concentration.
- Fixed emission approximation (FEA): A method that applies a model trained on one year’s emissions to other years’ weather, so weather and emission effects can be separated.
- SHAP: A technique that shows how much each input variable pushes a model’s prediction up or down.
- FNR: The satellite formaldehyde-to-NO2 ratio, used to tell whether ozone production is limited by VOCs or by NOx.
Original paper
Tracking surface ozone responses to clean air actions under a warming climate in China using machine learning
Atmospheric Chemistry and Physics · 19 January 2026
AI-generated summary of the original article; changes were made. Check the original before relying on it.