Urban ozone peaks fall while low ozone rises in Europe and the USA, 2000–2021
Across 353 urban sites, low and median ozone levels mostly rose while the highest levels mostly fell, with signs of renewed rises at the top end in the US Intermountain West.
Why it matters
Cutting precursor emissions has not lowered ozone everywhere, so exposure risk differs by region and by part of the ozone range. The authors say ozone trends should keep being monitored as climate change brings warmer summers, wildfires and heatwaves. Rising trends were found in places that are already hot and dry.
What they did
The authors used hourly urban ozone records from the TOAR-II and European Environment Agency databases for 2000–2021. After quality control they had 353 time series, 204 in Europe and 149 in the USA. They fitted piecewise quantile regression with up to two change points, which tracks low, median and high ozone separately. They then grouped sites with similar time series using hierarchical clustering with dynamic time warping, and compared trends with exposure metrics.
Key findings
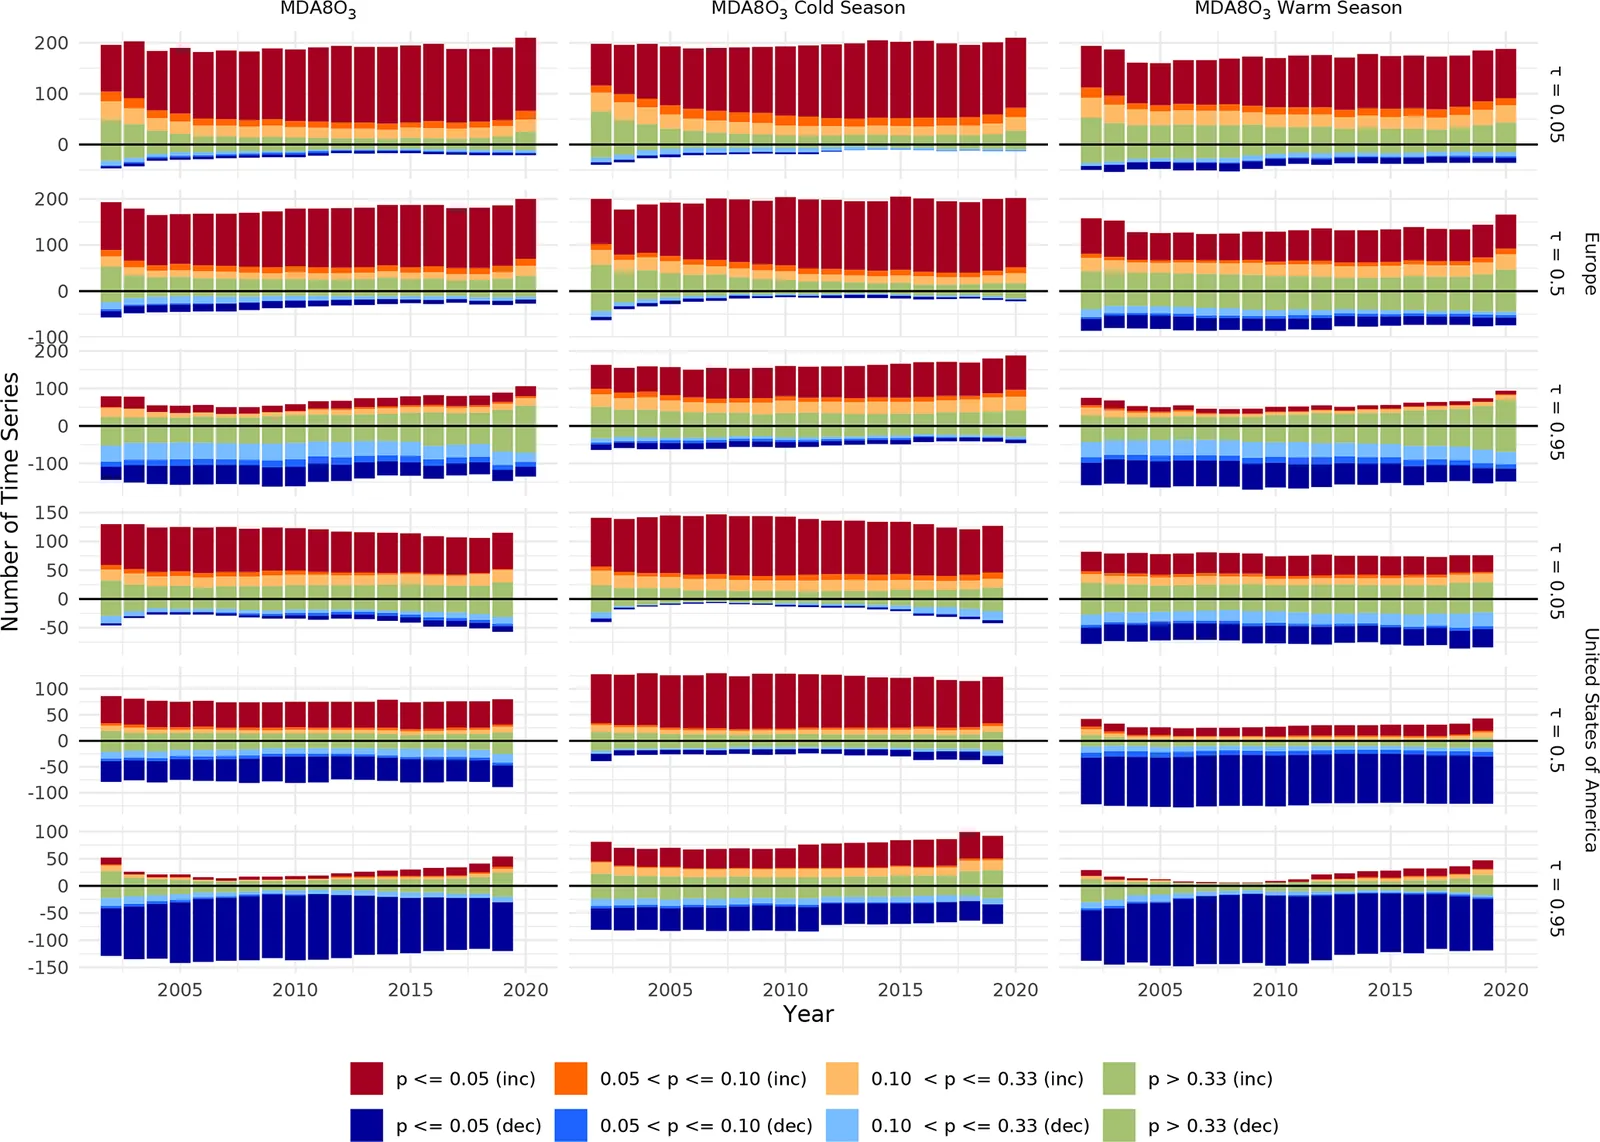
- In Europe, many sites showed high-certainty increasing trends in the 5th and 50th quantiles, while most high-certainty 95th quantile trends were decreasing.
- The USA showed a similar pattern: 5th quantile trends mostly rose and 95th quantile trends mostly fell, mainly in the warm season.
- A small but growing number of US sites showed a return to increasing trends at the 95th quantile, mostly in the west and centre of the country.
- Clusters were largely regional. Increases appeared in southern and central alpine Europe, and in California and the Intermountain West.
- In the Intermountain West, 95th quantile trends moved from low certainty in 2004 to high-certainty increases in 2018, possibly linked to warmer summers and wildfires.
Limitations
- Change points were more common near the start and end of the series, which may reflect edge effects, and COVID-19 may have added some in Europe.
- The study cannot say whether the link to wildfires or warmer summers is real, nor whether heatwave effects faded because of weaker ozone–temperature sensitivity or narrower heatwaves.
- Missing 2012 data in the USA prevented any comment on that year’s heatwave.
Glossary
- MDA8O3: Maximum daily 8-hour average ozone concentration.
- Quantile regression: A trend-fitting method that estimates trends for chosen parts of the data, such as the low 5th or high 95th percent.
- Change point: A year where the fitted trend line changes slope.
- Dynamic time warping: A way to measure similarity between time series that allows features to be shifted in time.
Original paper
Urban ozone trends in Europe and the USA (2000–2021)
Atmospheric Chemistry and Physics · 18 November 2025
AI-generated summary of the original article; changes were made. Check the original before relying on it.