Low-producing US well-pads emit over half of well-pad methane but make 5% of output
In this preprint, satellite data suggest that US oil and gas well-pads producing under 15 boe per day account for 5% of production but over half of well-pad methane emissions.
Why it matters
The numerous low-producing well-pads look like a major methane mitigation target, even though each one emits little. The authors say cutting these emissions will likely need broad, systemic approaches because the sites are so many and so spread out. The work also shows that fine-resolution satellite data can separate emissions by production level, which coarser data cannot do as well.
What they did
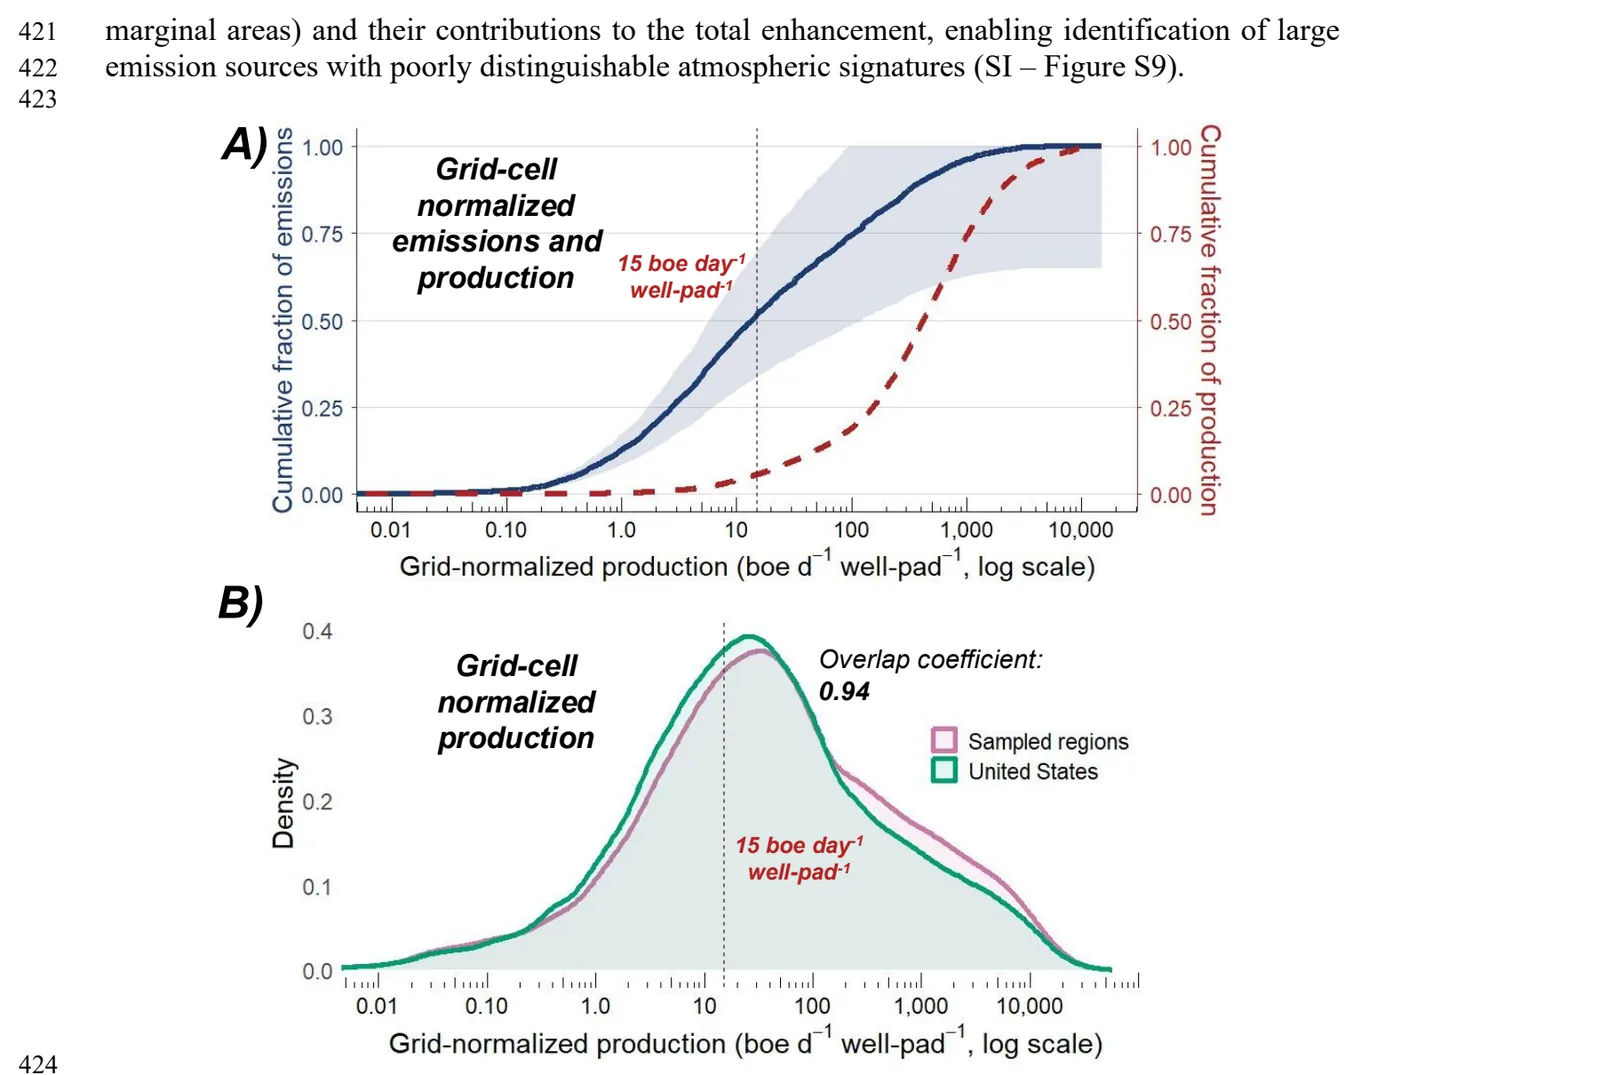
The team used 74 scenes from the MethaneSAT satellite, taken from May 2024 to June 2025. The scenes cover 84% of US onshore marketed oil and gas production. They turned the scenes into methane emission estimates on 4 × 4 km grid cells. They kept only cells with production well-pads and no other oil and gas infrastructure. They split these cells into marginal and non-marginal by average production per well-pad, using a 15 boe per day cutoff. They then extrapolated to the whole contiguous US and used simulations to correct for grid-cell averaging.
Key findings
- Total oil and gas methane emissions in the observed regions are 6.6 Tg a-1 (95% CI: 5.0–8.3). The observed regions cover 84% of onshore marketed production.
- Estimated well-pad emissions for the contiguous US are 9.6 Tg a-1 (95% CI: 6.8–12.4).
- Marginal well-pads are estimated to emit 58% (95% CI: 36–79) of well-pad emissions while producing 5% of national production.
- Marginal well-pads have a loss rate of 16% (95% CI: 10–23), against 0.6% (95% CI: 0.3–0.8) for non-marginal well-pads.
- Only 16% of grid cells fall below the industry loss-rate target of 0.2%.
- In the Permian, the marginal share of 33% matches an independent aerial LiDAR estimate of 35%.
Limitations
- Production-only cells cover 45% of well-pads. Extrapolation to the rest of the US relies on a fitted link between production and emission intensity.
- Marginal status is set by the grid-cell average, not per well-pad, so the authors had to correct it with simulations. Emissions are assumed to be spread equally among well-pads in a cell.
- Infrastructure data have gaps and omit sources such as abandoned wells. Scenes are snapshots that do not cover the full year or the full day. This is a preprint and has not been peer reviewed.
Glossary
- boe: Barrel of oil equivalent, a unit that puts oil and gas output on one energy scale.
- Marginal well-pad: A well site producing less than 15 barrels of oil equivalent per day.
- Loss rate: Methane emitted as a percentage of gas production.
- Energy intensity: Kilograms of methane emitted per gigajoule of oil and gas energy produced.
Original paper
Methane emissions intensity mapping from space reveals outsized emissions impact from marginal oil and gas production in the U.S.
EarthArXiv · 9 August 2026
This paper is a preprint. It has not been peer reviewed, and its results may change.
AI-generated summary of the original article; changes were made. Check the original before relying on it.