Satellite data show a data center power plant emitting about 16 times its permitted NOx
NASA's TEMPO satellite detected nitrogen oxide emissions from the Colossus 2 gas turbine plant that averaged 730±185 kg h-1 after February 2026, roughly 16 times the permit-based expectation of about 47 kg h-1.
Why it matters
Data centers increasingly run on their own gas turbines, and their emissions have had little outside checking. This preprint shows a satellite can see large emissions from such a site and compare them with permit limits. The authors say the approach could support independent monitoring of compliance, and that similar analysis could be done with instruments that have global coverage.
What they did
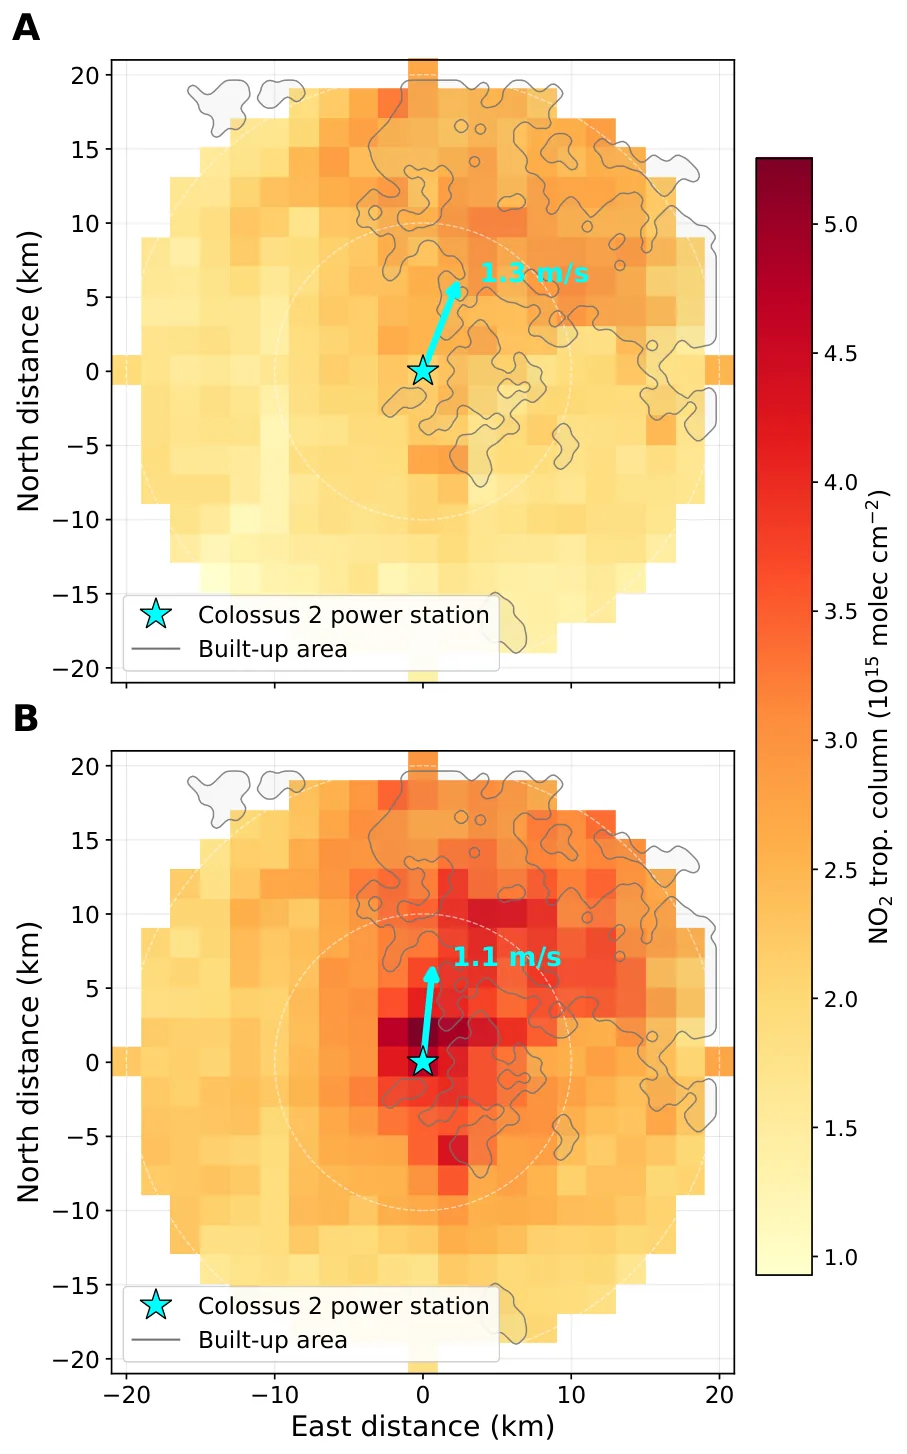
The authors compared NO2 columns from the TEMPO geostationary satellite near the Colossus 2 power plant before and after operations began. They averaged hourly scenes in two-week blocks, rotating each one to line up the wind direction, and subtracted a pre-operation background. They then estimated emissions with a cross-sectional flux method. They calibrated it against continuous emission monitoring data from four US power plants.
Key findings
- Local NO2 columns rose after operations began. The peak went from 3.2 x 10^15 molec cm-2 over Memphis in 2025 to 5.3 x 10^15 molec cm-2 just north of the plant in 2026.
- A plume was first detected in December 2025, at 460±180 kg NOx h-1.
- Emissions peaked at about 1180±180 kg h-1 in August 2026 and averaged 730±185 kg h-1 after February 2026.
- That average is roughly 16 times the 47 kg h-1 expected from the March 2026 permit for 41 turbines with best available controls. Emissions at the permitted level would be undetectable with this method.
- The authors infer 171±43 t NOx per year for each turbine without SCR.
Limitations
- The satellite method underestimated reported power plant emissions by a factor of 2.17±0.07 and had to be corrected with a calibration. The authors say this could come from errors in the NOx-to-NO2 ratio, plume masking or the satellite retrievals.
- Removing the urban background relies on pre-operation observations. A fixed NOx-to-NO2 ratio assumes steady-state chemistry.
- Results are two-week averages, so the method cannot resolve short-term changes. It also cannot detect emissions at permitted levels.
Glossary
- TEMPO: A NASA geostationary satellite instrument that measures NO2 hourly over the contiguous United States.
- CEMS: Continuous emission monitoring systems, which record the actual emissions of power plants.
- SCR: Selective catalytic reduction, an exhaust treatment that cuts NOx emissions from turbines.
- Cross-sectional flux method: A way to estimate a source’s emission rate by adding up the pollutant across the plume at several distances downwind.
Original paper
Quantifying AI data center nitrogen oxide (NO$_x$) emissions from space
arXiv · 23 August 2026
This paper is a preprint. It has not been peer reviewed, and its results may change.
AI-generated summary of the original article; changes were made. Check the original before relying on it.