Two hotspots at a Korean petrochemical complex emit about 37.1 % of its reported total
Measurements from the ground, a vehicle, an aircraft and a satellite suggest that two facilities in the Daesan petrochemical complex emit about 37.1 % of the whole complex's inventory total, which points to underreported methane leaks.
Why it matters
National inventories rely on activity statistics and assumed emission factors, which can miss leaks and irregular releases. This preprint shows how several measurement types can be combined to check an industrial site from the outside. The authors say the approach could be used at other industrial complexes.
What they did
The team ran a campaign from 6–14 January 2024 at the Daesan Petrochemical Industrial Complex in South Korea. They used a fixed CO2 sensor, three column spectrometers (EM27/SUN), a mobile measurement vehicle, an aircraft flown on three days, and satellite data from EMIT. Mobile fixed-point readings at the two biggest hotspots were turned into emission rates with a Gaussian plume method (OTM-33A). The satellite scene came from 7 April 2024, because none was available during the campaign.
Key findings
- CO2 inside the complex averaged 469.28 ppm. That was 27.72 ppm above the nearby background station at Anmyeon-do.
- Spectrometers at downwind sites often saw emission plumes leave the complex. Light winds on 8 and 13 January let enhancements build up inside it.
- Mobile data from the two hotspots gave about 2523.62 ± 251.23 GgCO2eq per year. That is about 37.1 % of the 6796.59 GgCO2eq per year in the 2022 national inventory for the complex.
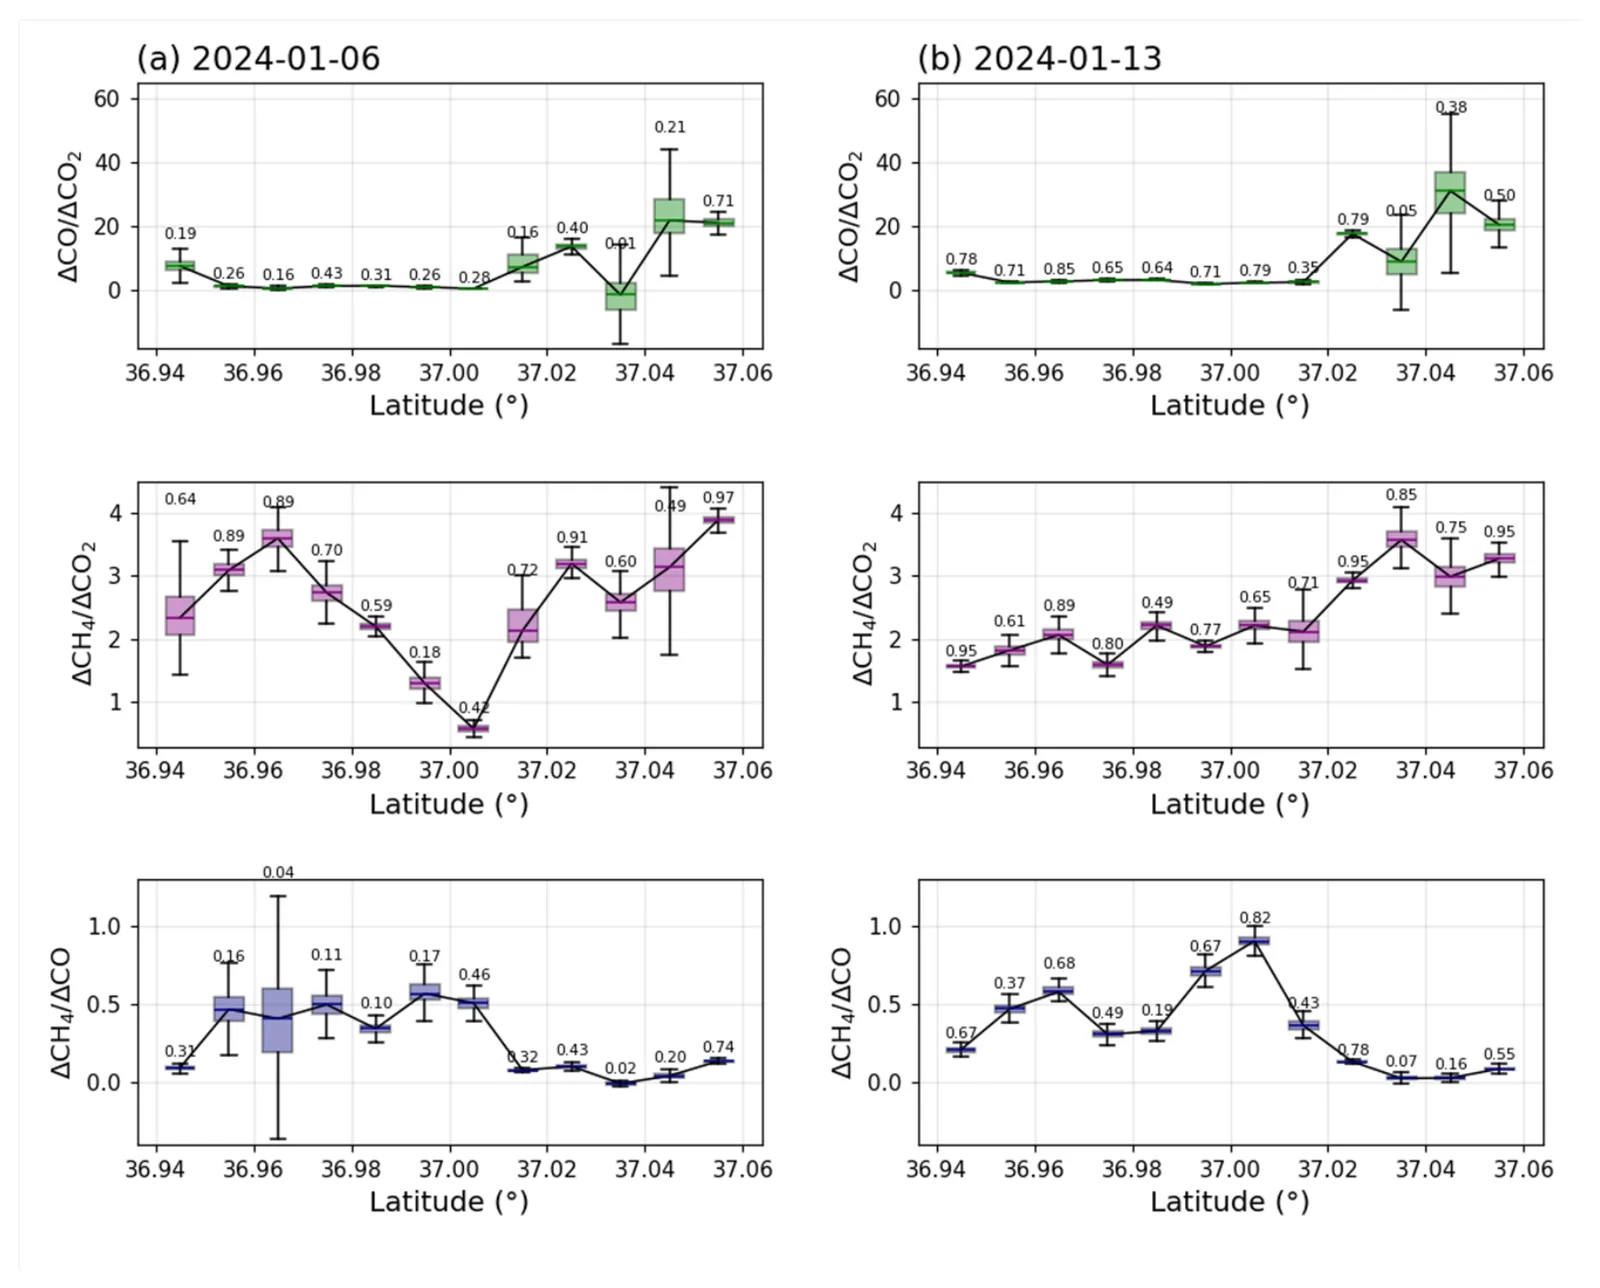
- Aircraft enhancement ratios showed combustion-type CO and separate methane leak signals in the same area.
- EMIT showed average methane enhancement in the complex 31.14 % higher than outside it. Some of the hotspots matched mobile readings.
Limitations
- The campaign covered only nine days in one winter, so seasonal changes in emissions cannot be ruled out.
- Emission rates come from short fixed-point readings and a simple plume model with assumed uncertainties. The estimate covers only two accessible hotspots.
- The EMIT scene is from April, not January. The authors could not confirm on the ground what causes the enhancements in restricted areas. The platforms may also agree partly because they sample the same source regions.
Glossary
- EM27/SUN: A portable spectrometer that points at the sun to measure the average gas amount in the whole air column.
- OTM-33A: A U.S. EPA test method that estimates an emission rate from downwind concentration readings and wind data.
- Fugitive emissions: Unintended gas leaks and venting from equipment such as tanks, pipes and valves.
- EMIT: An imaging spectrometer on the International Space Station that can map methane enhancements from space.
Original paper
Measurement report: Multi-platform greenhouse gas monitoring of a major petrochemical industrial complex in South Korea
EGUsphere · 3 September 2026
This paper is a preprint. It has not been peer reviewed, and its results may change.
AI-generated summary of the original article; changes were made. Check the original before relying on it.